- United States
- /
- Auto
- /
- NasdaqCM:EZGO
Some EZGO Technologies Ltd. (NASDAQ:EZGO) Shareholders Look For Exit As Shares Take 59% Pounding

The EZGO Technologies Ltd. (NASDAQ:EZGO) share price has fared very poorly over the last month, falling by a substantial 59%. For any long-term shareholders, the last month ends a year to forget by locking in a 98% share price decline.
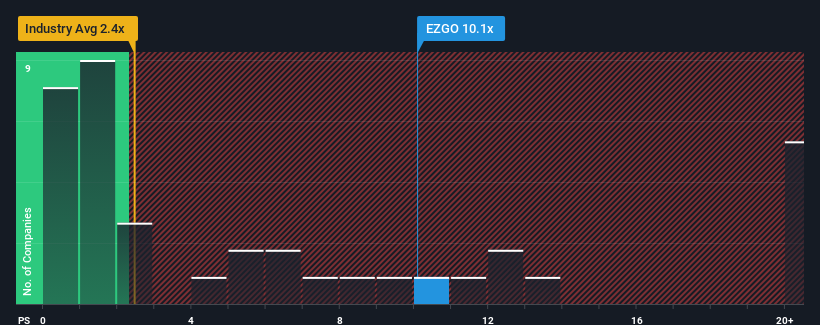
In spite of the heavy fall in price, you could still be forgiven for thinking EZGO Technologies is a stock to steer clear of with a price-to-sales ratios (or "P/S") of 10.1x, considering almost half the companies in the United States' Auto industry have P/S ratios below 2.4x. However, the P/S might be quite high for a reason and it requires further investigation to determine if it's justified.
Check out our latest analysis for EZGO Technologies
What Does EZGO Technologies' P/S Mean For Shareholders?
For instance, EZGO Technologies' receding revenue in recent times would have to be some food for thought. It might be that many expect the company to still outplay most other companies over the coming period, which has kept the P/S from collapsing. You'd really hope so, otherwise you're paying a pretty hefty price for no particular reason.
Want the full picture on earnings, revenue and cash flow for the company? Then our free report on EZGO Technologies will help you shine a light on its historical performance.How Is EZGO Technologies' Revenue Growth Trending?
In order to justify its P/S ratio, EZGO Technologies would need to produce outstanding growth that's well in excess of the industry.
Taking a look back first, the company's revenue growth last year wasn't something to get excited about as it posted a disappointing decline of 8.4%. This has erased any of its gains during the last three years, with practically no change in revenue being achieved in total. Accordingly, shareholders probably wouldn't have been overly satisfied with the unstable medium-term growth rates.
This is in contrast to the rest of the industry, which is expected to grow by 13% over the next year, materially higher than the company's recent medium-term annualised growth rates.
With this information, we find it concerning that EZGO Technologies is trading at a P/S higher than the industry. Apparently many investors in the company are way more bullish than recent times would indicate and aren't willing to let go of their stock at any price. There's a good chance existing shareholders are setting themselves up for future disappointment if the P/S falls to levels more in line with recent growth rates.
The Bottom Line On EZGO Technologies' P/S
Even after such a strong price drop, EZGO Technologies' P/S still exceeds the industry median significantly. Typically, we'd caution against reading too much into price-to-sales ratios when settling on investment decisions, though it can reveal plenty about what other market participants think about the company.
The fact that EZGO Technologies currently trades on a higher P/S relative to the industry is an oddity, since its recent three-year growth is lower than the wider industry forecast. When we observe slower-than-industry revenue growth alongside a high P/S ratio, we assume there to be a significant risk of the share price decreasing, which would result in a lower P/S ratio. If recent medium-term revenue trends continue, it will place shareholders' investments at significant risk and potential investors in danger of paying an excessive premium.
You should always think about risks. Case in point, we've spotted 4 warning signs for EZGO Technologies you should be aware of, and 3 of them are a bit concerning.
Of course, profitable companies with a history of great earnings growth are generally safer bets. So you may wish to see this free collection of other companies that have reasonable P/E ratios and have grown earnings strongly.
Mobile Infrastructure for Defense and Disaster
The next wave in robotics isn't humanoid. Its fully autonomous towers delivering 5G, ISR, and radar in under 30 minutes, anywhere.
Get the investor briefing before the next round of contracts
Sponsored On Behalf of CiTechValuation is complex, but we're here to simplify it.
Discover if EZGO Technologies might be undervalued or overvalued with our detailed analysis, featuring fair value estimates, potential risks, dividends, insider trades, and its financial condition.
Access Free AnalysisHave feedback on this article? Concerned about the content? Get in touch with us directly. Alternatively, email editorial-team (at) simplywallst.com.
This article by Simply Wall St is general in nature. We provide commentary based on historical data and analyst forecasts only using an unbiased methodology and our articles are not intended to be financial advice. It does not constitute a recommendation to buy or sell any stock, and does not take account of your objectives, or your financial situation. We aim to bring you long-term focused analysis driven by fundamental data. Note that our analysis may not factor in the latest price-sensitive company announcements or qualitative material. Simply Wall St has no position in any stocks mentioned.
About NasdaqCM:EZGO
EZGO Technologies
Designs, manufactures, rents, and sells e-bicycles and e-tricycles in the People’s Republic of China.
Moderate risk with mediocre balance sheet.
Similar Companies
Market Insights

Weekly Picks

Early mover in a fast growing industry. Likely to experience share price volatility as they scale


A case for CA$31.80 (undiluted), aka 8,616% upside from CA$0.37 (an 86 bagger!).


Moderation and Stabilisation: HOLD: Fair Price based on a 4-year Cycle is $12.08
Recently Updated Narratives

Airbnb Stock: Platform Growth in a World of Saturation and Scrutiny

Adobe Stock: AI-Fueled ARR Growth Pushes Guidance Higher, But Cost Pressures Loom

Thomson Reuters Stock: When Legal Intelligence Becomes Mission-Critical Infrastructure
Popular Narratives


Crazy Undervalued 42 Baggers Silver Play (Active & Running Mine)


NVDA: Expanding AI Demand Will Drive Major Data Center Investments Through 2026

The AI Infrastructure Giant Grows Into Its Valuation
Trending Discussion


