Stock Analysis
- Taiwan
- /
- Communications
- /
- TWSE:6442
Is EZconn Corporation's (TWSE:6442) Recent Stock Performance Influenced By Its Fundamentals In Any Way?


EZconn (TWSE:6442) has had a great run on the share market with its stock up by a significant 76% over the last three months. Given that stock prices are usually aligned with a company's financial performance in the long-term, we decided to study its financial indicators more closely to see if they had a hand to play in the recent price move. Particularly, we will be paying attention to EZconn's ROE today.
Return on equity or ROE is an important factor to be considered by a shareholder because it tells them how effectively their capital is being reinvested. In simpler terms, it measures the profitability of a company in relation to shareholder's equity.
See our latest analysis for EZconn
How Do You Calculate Return On Equity?
The formula for ROE is:
Return on Equity = Net Profit (from continuing operations) ÷ Shareholders' Equity
So, based on the above formula, the ROE for EZconn is:
8.2% = NT$168m ÷ NT$2.1b (Based on the trailing twelve months to December 2023).
The 'return' is the income the business earned over the last year. So, this means that for every NT$1 of its shareholder's investments, the company generates a profit of NT$0.08.
Why Is ROE Important For Earnings Growth?
So far, we've learned that ROE is a measure of a company's profitability. We now need to evaluate how much profit the company reinvests or "retains" for future growth which then gives us an idea about the growth potential of the company. Generally speaking, other things being equal, firms with a high return on equity and profit retention, have a higher growth rate than firms that don’t share these attributes.
EZconn's Earnings Growth And 8.2% ROE
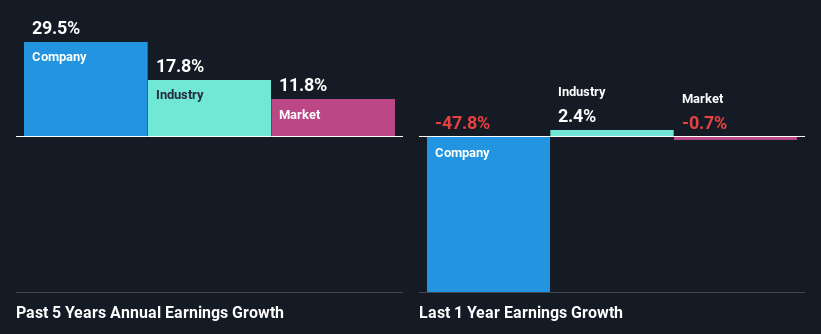
At first glance, EZconn's ROE doesn't look very promising. Yet, a closer study shows that the company's ROE is similar to the industry average of 10%. Looking at EZconn's exceptional 29% five-year net income growth in particular, we are definitely impressed. Considering the moderately low ROE, it is quite possible that there might be some other aspects that are positively influencing the company's earnings growth. For instance, the company has a low payout ratio or is being managed efficiently.
We then compared EZconn's net income growth with the industry and we're pleased to see that the company's growth figure is higher when compared with the industry which has a growth rate of 18% in the same 5-year period.
Earnings growth is a huge factor in stock valuation. What investors need to determine next is if the expected earnings growth, or the lack of it, is already built into the share price. This then helps them determine if the stock is placed for a bright or bleak future. Is EZconn fairly valued compared to other companies? These 3 valuation measures might help you decide.
Is EZconn Efficiently Re-investing Its Profits?
EZconn has a significant three-year median payout ratio of 57%, meaning the company only retains 43% of its income. This implies that the company has been able to achieve high earnings growth despite returning most of its profits to shareholders.
Additionally, EZconn has paid dividends over a period of at least ten years which means that the company is pretty serious about sharing its profits with shareholders.
Conclusion
In total, it does look like EZconn has some positive aspects to its business. While no doubt its earnings growth is pretty substantial, we do feel that the reinvestment rate is pretty low, meaning, the earnings growth number could have been significantly higher had the company been retaining more of its profits. So far, we've only made a quick discussion around the company's earnings growth. To gain further insights into EZconn's past profit growth, check out this visualization of past earnings, revenue and cash flows.
Valuation is complex, but we're helping make it simple.
Find out whether EZconn is potentially over or undervalued by checking out our comprehensive analysis, which includes fair value estimates, risks and warnings, dividends, insider transactions and financial health.
View the Free AnalysisHave feedback on this article? Concerned about the content? Get in touch with us directly. Alternatively, email editorial-team (at) simplywallst.com.
This article by Simply Wall St is general in nature. We provide commentary based on historical data and analyst forecasts only using an unbiased methodology and our articles are not intended to be financial advice. It does not constitute a recommendation to buy or sell any stock, and does not take account of your objectives, or your financial situation. We aim to bring you long-term focused analysis driven by fundamental data. Note that our analysis may not factor in the latest price-sensitive company announcements or qualitative material. Simply Wall St has no position in any stocks mentioned.
About TWSE:6442
EZconn
Provides electronic products, optical fiber components, and precision metal components.
Excellent balance sheet with questionable track record.
