
Advertisement

Amidst escalating geopolitical tensions and fluctuating trade dynamics, Asian markets have shown resilience, with some indices experiencing mixed performances due to regional economic pressures and global uncertainties. In this environment, identifying promising high-growth tech stocks in Asia involves focusing on companies with robust innovation capabilities and the potential to navigate these complex market conditions effectively.
Top 10 High Growth Tech Companies In Asia
| Name | Revenue Growth | Earnings Growth | Growth Rating |
|---|---|---|---|
| Suzhou TFC Optical Communication | 29.78% | 30.32% | ★★★★★★ |
| Shengyi Electronics | 22.99% | 35.16% | ★★★★★★ |
| Fositek | 26.71% | 33.90% | ★★★★★★ |
| Shanghai Huace Navigation Technology | 24.44% | 23.48% | ★★★★★★ |
| Range Intelligent Computing Technology Group | 27.31% | 28.63% | ★★★★★★ |
| eWeLLLtd | 24.95% | 24.40% | ★★★★★★ |
| PharmaResearch | 24.40% | 25.85% | ★★★★★★ |
| Nanya New Material TechnologyLtd | 22.72% | 63.29% | ★★★★★★ |
| Global Security Experts | 20.56% | 28.04% | ★★★★★★ |
| JNTC | 54.24% | 87.93% | ★★★★★★ |
Below we spotlight a couple of our favorites from our exclusive screener.
Q Technology (Group) (SEHK:1478)
Simply Wall St Growth Rating: ★★★★☆☆
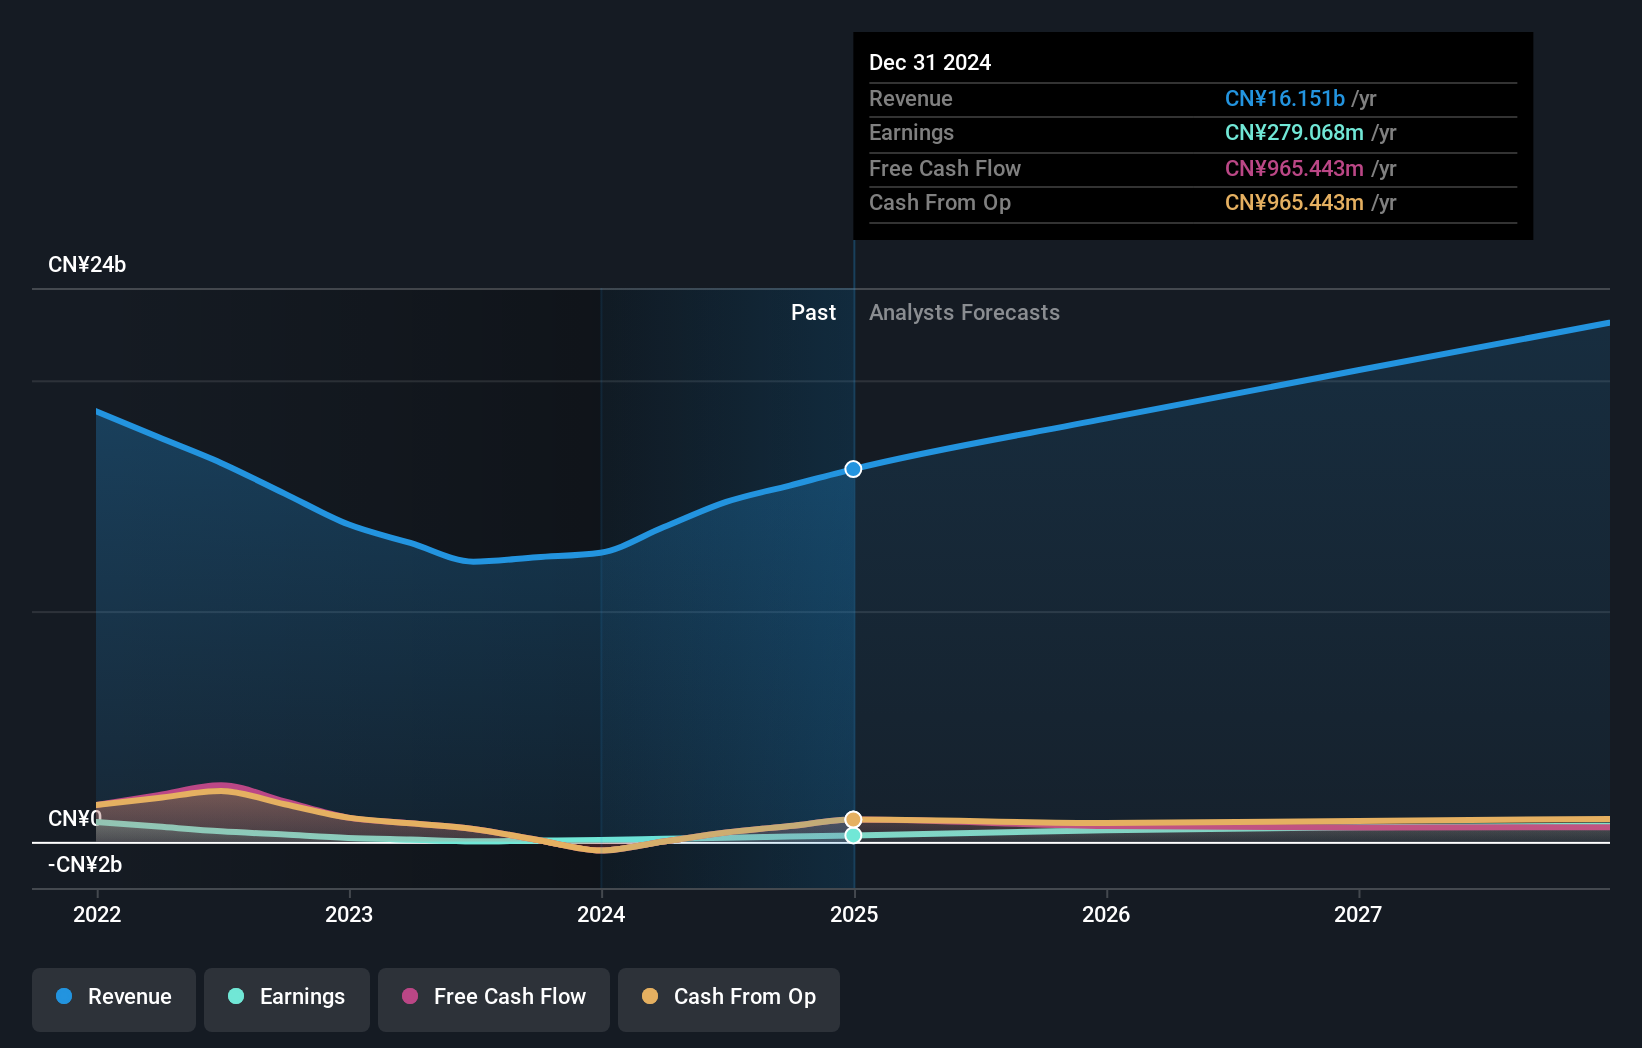
Overview: Q Technology (Group) Company Limited is an investment holding company involved in the design, R&D, manufacturing, and sale of camera and fingerprint recognition modules across Mainland China, Hong Kong, India, and internationally with a market cap of HK$9.31 billion.
Operations: Q Technology (Group) generates revenue primarily from the sale of camera modules, amounting to CN¥14.83 billion, and fingerprint recognition modules, totaling CN¥1.18 billion.
Q Technology (Group) has demonstrated robust performance with a notable 240.7% earnings growth over the past year, significantly outpacing the electronic industry's average of 17.1%. This growth is supported by strong sales volumes in camera and fingerprint recognition modules, highlighting its dominance in these segments. Despite an expected slowdown in revenue growth to 8.8% annually, earnings are forecasted to surge by 20.9% per year, well above Hong Kong's market average of 10.6%. The company also continues to reward shareholders, affirming a final dividend of HK$0.10 per share at its recent AGM, underscoring its financial health and commitment to returning value.
- Navigate through the intricacies of Q Technology (Group) with our comprehensive health report here.
Understand Q Technology (Group)'s track record by examining our Past report.
Cybozu (TSE:4776)
Simply Wall St Growth Rating: ★★★★★☆
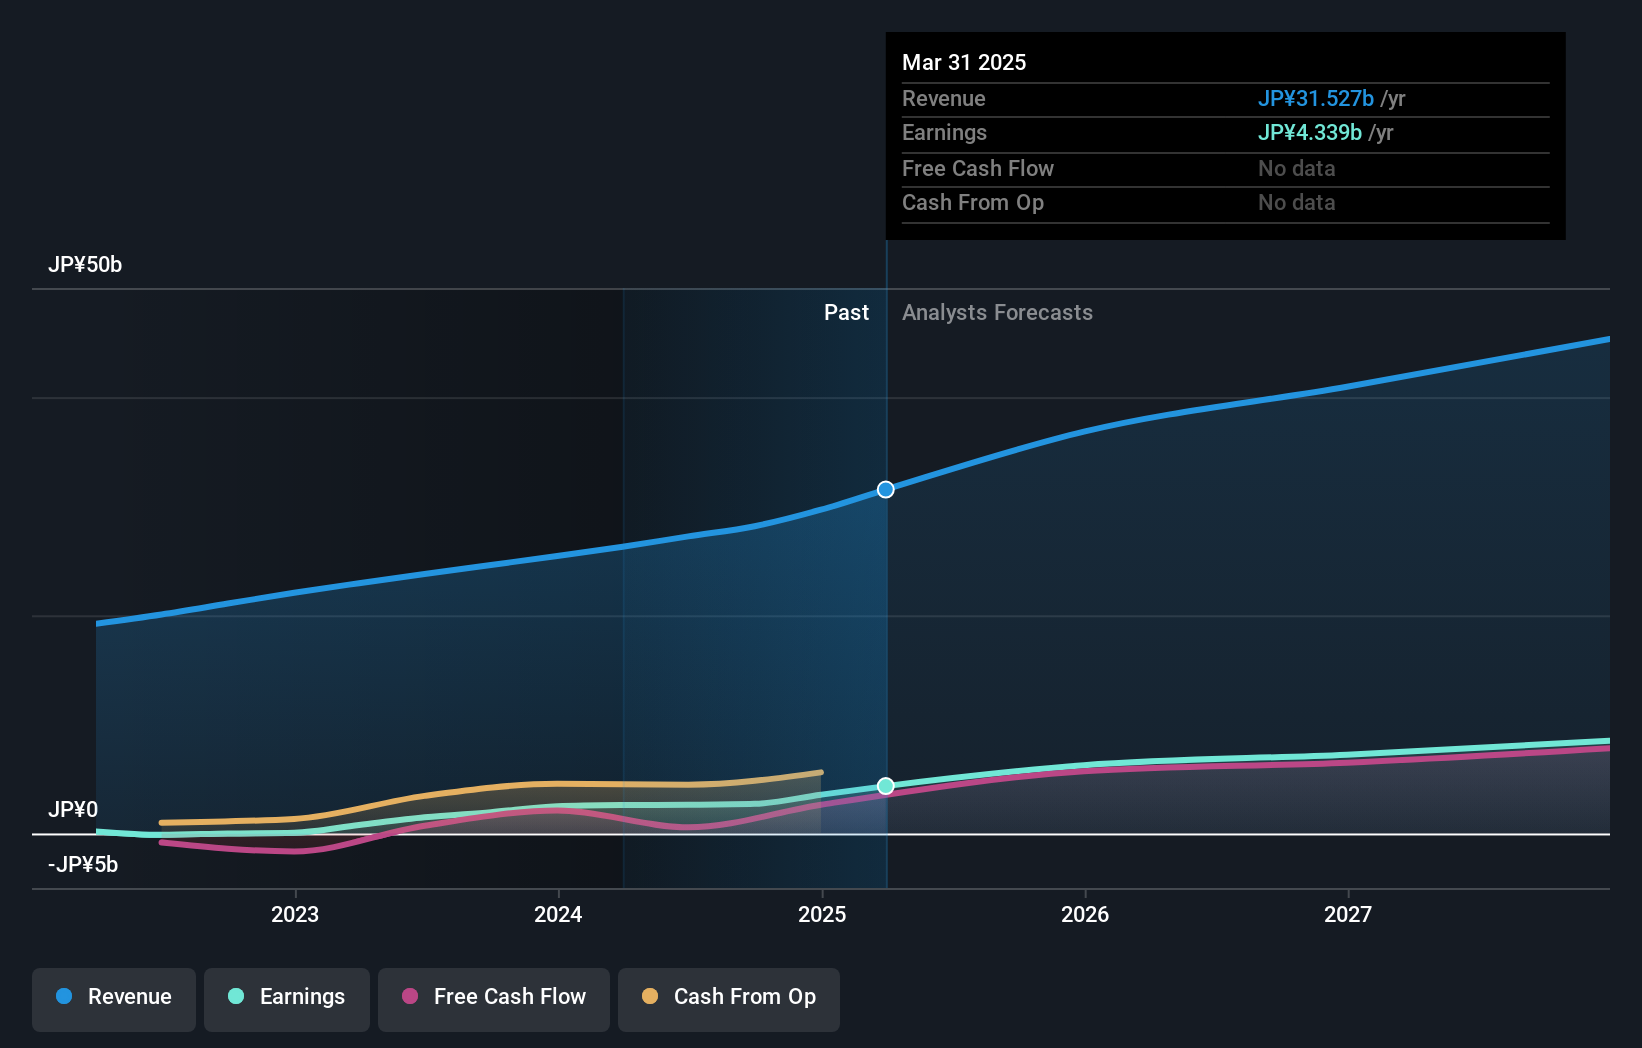
Overview: Cybozu, Inc. is a Japanese company that specializes in the development, sale, and operation of groupware solutions, with a market capitalization of ¥163.57 billion.
Operations: The company focuses on groupware solutions, generating revenue primarily through the development, sale, and operation of these software products in Japan. With a market capitalization of ¥163.57 billion, it operates within the tech industry to provide collaborative tools for businesses.
Cybozu's recent performance underscores its burgeoning role in Asia's tech landscape, with a sharp increase in quarterly sales to JPY 8.76 billion, up from JPY 6.91 billion year-over-year, and net income more than doubling to JPY 1.80 billion. These figures are bolstered by consistent monthly sales growth, peaking at JPY 2.99 billion in April 2025 alone. The company's robust earnings trajectory is set against a backdrop of high-quality earnings and an expected annual revenue growth rate of 12.6%, outpacing the Japanese market average of 3.7%. This financial vitality is further exemplified at industry conferences like KubeCon + CloudNativeCon Japan, where Cybozu showcased its strategic initiatives, hinting at sustained forward momentum driven by innovation and market adaptation.
Chenming Electronic Tech (TWSE:3013)
Simply Wall St Growth Rating: ★★★★★☆
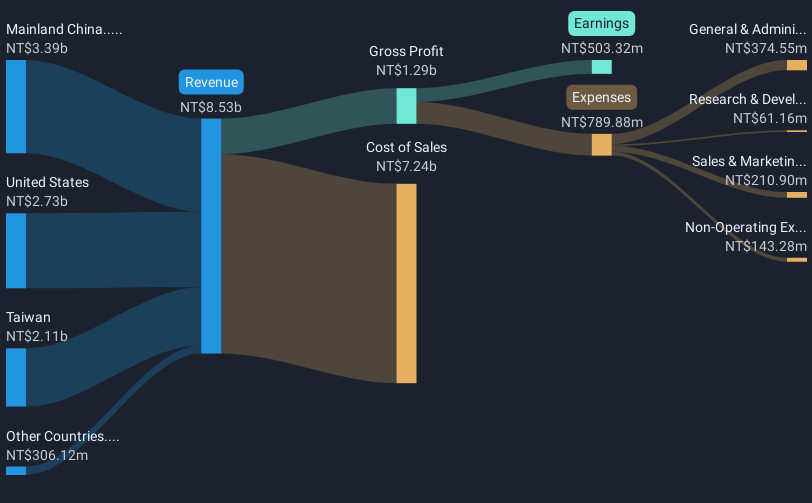
Overview: Chenming Electronic Tech. Corp. is an OEM/ODM manufacturer involved in the R&D, manufacturing, and sale of computer and server cases, server chassis, mobile device components, and molds across Taiwan, China, the United States, and globally with a market cap of NT$23.69 billion.
Operations: Chenming Electronic Tech. Corp. generates revenue primarily from the production and sales of computer and mobile device components, amounting to NT$10.35 billion.
Chenming Electronic Tech has demonstrated robust financial performance, with first-quarter sales soaring to TWD 2.4 billion, a significant leap from TWD 1.46 billion the previous year, and net income more than doubling to TWD 172.25 million. This growth trajectory is underscored by an impressive annual revenue increase of 31.1% and earnings growth of 26.6%. The company's commitment to innovation is evident in its recent amendments to its Articles of Incorporation, positioning it well amidst Asia's competitive tech landscape despite a volatile share price in recent months.
- Dive into the specifics of Chenming Electronic Tech here with our thorough health report.
Evaluate Chenming Electronic Tech's historical performance by accessing our past performance report.
Turning Ideas Into Actions
- Discover the full array of 488 Asian High Growth Tech and AI Stocks right here.
- Have a stake in these businesses? Integrate your holdings into Simply Wall St's portfolio for notifications and detailed stock reports.
- Join a community of smart investors by using Simply Wall St. It's free and delivers expert-level analysis on worldwide markets.
Seeking Other Investments?
- Explore high-performing small cap companies that haven't yet garnered significant analyst attention.
- Fuel your portfolio with companies showing strong growth potential, backed by optimistic outlooks both from analysts and management.
- Find companies with promising cash flow potential yet trading below their fair value.
This article by Simply Wall St is general in nature. We provide commentary based on historical data and analyst forecasts only using an unbiased methodology and our articles are not intended to be financial advice. It does not constitute a recommendation to buy or sell any stock, and does not take account of your objectives, or your financial situation. We aim to bring you long-term focused analysis driven by fundamental data. Note that our analysis may not factor in the latest price-sensitive company announcements or qualitative material. Simply Wall St has no position in any stocks mentioned.
New: AI Stock Screener & Alerts
Our new AI Stock Screener scans the market every day to uncover opportunities.
• Dividend Powerhouses (3%+ Yield)
• Undervalued Small Caps with Insider Buying
• High growth Tech and AI Companies
Or build your own from over 50 metrics.
Have feedback on this article? Concerned about the content? Get in touch with us directly. Alternatively, email editorial-team@simplywallst.com
About TSE:4776
Outstanding track record with flawless balance sheet and pays a dividend.
Market Insights

Advertisement
Community Narratives
The Future of Drug Testing? Fingerprint Tech Shows Serious Promise
Fair Value US$2.98|35.9% undervalued
JO
Community Contributor
Occidental Petroleum is set to achieve a 16% profit margin improvement
Fair Value US$55.05|15.6% undervalued
DZ
Community Contributor
Argan's Revenue Set to Soar with a 13.31% Growth in the Coming Decade
Fair Value US$284.68|23.4% undervalued
KE
Community Contributor
EU#1 - From German Startup to EU’s Biggest Company
Fair Value €248.62|2.5% overvalued
TO
Community Contributor