
The external fund manager backed by Berkshire Hathaway's Charlie Munger, Li Lu, makes no bones about it when he says 'The biggest investment risk is not the volatility of prices, but whether you will suffer a permanent loss of capital.' When we think about how risky a company is, we always like to look at its use of debt, since debt overload can lead to ruin. As with many other companies Promise Technology, Inc. (TPE:3057) makes use of debt. But is this debt a concern to shareholders?
When Is Debt A Problem?
Debt assists a business until the business has trouble paying it off, either with new capital or with free cash flow. If things get really bad, the lenders can take control of the business. While that is not too common, we often do see indebted companies permanently diluting shareholders because lenders force them to raise capital at a distressed price. Of course, debt can be an important tool in businesses, particularly capital heavy businesses. The first step when considering a company's debt levels is to consider its cash and debt together.
Check out our latest analysis for Promise Technology
What Is Promise Technology's Net Debt?
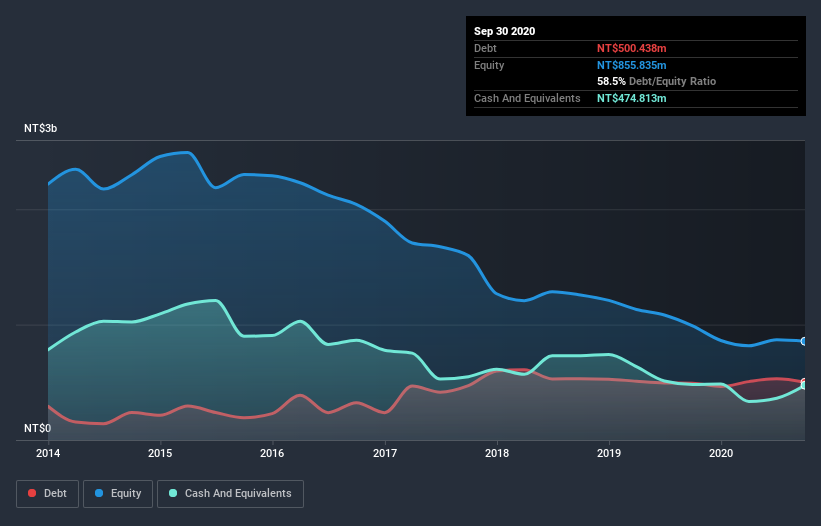
As you can see below, Promise Technology had NT$500.4m of debt, at September 2020, which is about the same as the year before. You can click the chart for greater detail. However, it also had NT$474.8m in cash, and so its net debt is NT$25.6m.
A Look At Promise Technology's Liabilities
According to the last reported balance sheet, Promise Technology had liabilities of NT$644.4m due within 12 months, and liabilities of NT$179.9m due beyond 12 months. On the other hand, it had cash of NT$474.8m and NT$153.3m worth of receivables due within a year. So its liabilities outweigh the sum of its cash and (near-term) receivables by NT$196.2m.
Promise Technology has a market capitalization of NT$964.6m, so it could very likely raise cash to ameliorate its balance sheet, if the need arose. However, it is still worthwhile taking a close look at its ability to pay off debt. When analysing debt levels, the balance sheet is the obvious place to start. But you can't view debt in total isolation; since Promise Technology will need earnings to service that debt. So if you're keen to discover more about its earnings, it might be worth checking out this graph of its long term earnings trend.
Over 12 months, Promise Technology made a loss at the EBIT level, and saw its revenue drop to NT$1.1b, which is a fall of 13%. We would much prefer see growth.
Caveat Emptor
Not only did Promise Technology's revenue slip over the last twelve months, but it also produced negative earnings before interest and tax (EBIT). Its EBIT loss was a whopping NT$198m. Considering that alongside the liabilities mentioned above does not give us much confidence that company should be using so much debt. Quite frankly we think the balance sheet is far from match-fit, although it could be improved with time. Another cause for caution is that is bled NT$134m in negative free cash flow over the last twelve months. So suffice it to say we consider the stock very risky. When analysing debt levels, the balance sheet is the obvious place to start. But ultimately, every company can contain risks that exist outside of the balance sheet. For instance, we've identified 3 warning signs for Promise Technology (1 is concerning) you should be aware of.
At the end of the day, it's often better to focus on companies that are free from net debt. You can access our special list of such companies (all with a track record of profit growth). It's free.
If you decide to trade Promise Technology, use the lowest-cost* platform that is rated #1 Overall by Barron’s, Interactive Brokers. Trade stocks, options, futures, forex, bonds and funds on 135 markets, all from a single integrated account. Promoted
The New Payments ETF Is Live on NASDAQ:
Money is moving to real-time rails, and a newly listed ETF now gives investors direct exposure. Fast settlement. Institutional custody. Simple access.
Explore how this launch could reshape portfolios
Sponsored ContentNew: Manage All Your Stock Portfolios in One Place
We've created the ultimate portfolio companion for stock investors, and it's free.
• Connect an unlimited number of Portfolios and see your total in one currency
• Be alerted to new Warning Signs or Risks via email or mobile
• Track the Fair Value of your stocks
This article by Simply Wall St is general in nature. It does not constitute a recommendation to buy or sell any stock, and does not take account of your objectives, or your financial situation. We aim to bring you long-term focused analysis driven by fundamental data. Note that our analysis may not factor in the latest price-sensitive company announcements or qualitative material. Simply Wall St has no position in any stocks mentioned.
*Interactive Brokers Rated Lowest Cost Broker by StockBrokers.com Annual Online Review 2020
Have feedback on this article? Concerned about the content? Get in touch with us directly. Alternatively, email editorial-team (at) simplywallst.com.
About TWSE:3057
Promise Technology
Develops storage solutions for the data center, surveillance, cloud, and media markets in Taiwan and internationally.
Flawless balance sheet with low risk.
Similar Companies
Market Insights

Weekly Picks

Early mover in a fast growing industry. Likely to experience share price volatility as they scale


A case for CA$31.80 (undiluted), aka 8,616% upside from CA$0.37 (an 86 bagger!).


Moderation and Stabilisation: HOLD: Fair Price based on a 4-year Cycle is $12.08
Recently Updated Narratives

Airbnb Stock: Platform Growth in a World of Saturation and Scrutiny

Adobe Stock: AI-Fueled ARR Growth Pushes Guidance Higher, But Cost Pressures Loom

Thomson Reuters Stock: When Legal Intelligence Becomes Mission-Critical Infrastructure
Popular Narratives


Crazy Undervalued 42 Baggers Silver Play (Active & Running Mine)


NVDA: Expanding AI Demand Will Drive Major Data Center Investments Through 2026

The AI Infrastructure Giant Grows Into Its Valuation
Trending Discussion


