
Advertisement
- Taiwan
- /
- Electronic Equipment and Components
- /
- TWSE:3023
SINBON Electronics (TPE:3023) Strong Profits May Be Masking Some Underlying Issues
The recent earnings posted by SINBON Electronics Co., Ltd. (TPE:3023) were solid, but the stock didn't move as much as we expected. However the statutory profit number doesn't tell the whole story, and we have found some factors which might be of concern to shareholders.
Check out our latest analysis for SINBON Electronics
Examining Cashflow Against SINBON Electronics' Earnings
In high finance, the key ratio used to measure how well a company converts reported profits into free cash flow (FCF) is the accrual ratio (from cashflow). To get the accrual ratio we first subtract FCF from profit for a period, and then divide that number by the average operating assets for the period. This ratio tells us how much of a company's profit is not backed by free cashflow.
Therefore, it's actually considered a good thing when a company has a negative accrual ratio, but a bad thing if its accrual ratio is positive. While it's not a problem to have a positive accrual ratio, indicating a certain level of non-cash profits, a high accrual ratio is arguably a bad thing, because it indicates paper profits are not matched by cash flow. Notably, there is some academic evidence that suggests that a high accrual ratio is a bad sign for near-term profits, generally speaking.
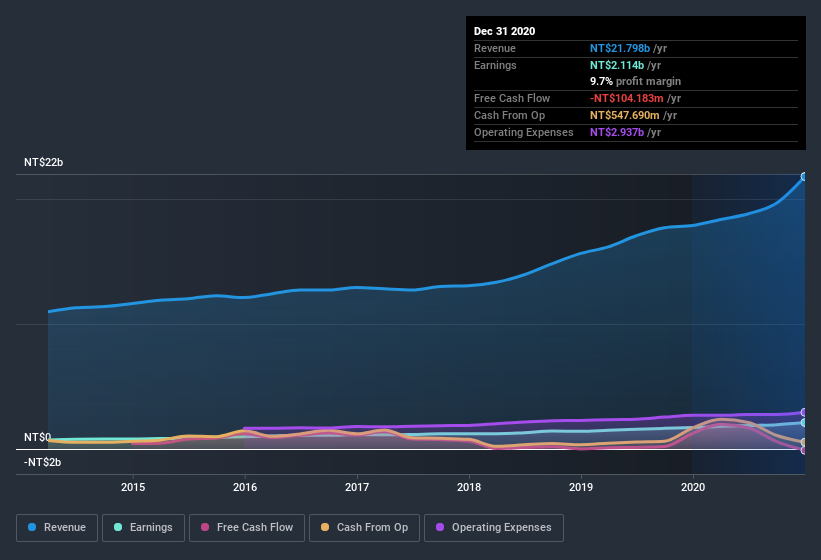
For the year to December 2020, SINBON Electronics had an accrual ratio of 0.27. Unfortunately, that means its free cash flow fell significantly short of its reported profits. Over the last year it actually had negative free cash flow of NT$104m, in contrast to the aforementioned profit of NT$2.11b. We saw that FCF was NT$1.3b a year ago though, so SINBON Electronics has at least been able to generate positive FCF in the past.
That might leave you wondering what analysts are forecasting in terms of future profitability. Luckily, you can click here to see an interactive graph depicting future profitability, based on their estimates.
Our Take On SINBON Electronics' Profit Performance
SINBON Electronics' accrual ratio for the last twelve months signifies cash conversion is less than ideal, which is a negative when it comes to our view of its earnings. Therefore, it seems possible to us that SINBON Electronics' true underlying earnings power is actually less than its statutory profit. But at least holders can take some solace from the 67% per annum growth in EPS for the last three. The goal of this article has been to assess how well we can rely on the statutory earnings to reflect the company's potential, but there is plenty more to consider. So while earnings quality is important, it's equally important to consider the risks facing SINBON Electronics at this point in time. Case in point: We've spotted 2 warning signs for SINBON Electronics you should be aware of.
Today we've zoomed in on a single data point to better understand the nature of SINBON Electronics' profit. But there is always more to discover if you are capable of focussing your mind on minutiae. For example, many people consider a high return on equity as an indication of favorable business economics, while others like to 'follow the money' and search out stocks that insiders are buying. So you may wish to see this free collection of companies boasting high return on equity, or this list of stocks that insiders are buying.
When trading SINBON Electronics or any other investment, use the platform considered by many to be the Professional's Gateway to the Worlds Market, Interactive Brokers. You get the lowest-cost* trading on stocks, options, futures, forex, bonds and funds worldwide from a single integrated account. Promoted
New: Manage All Your Stock Portfolios in One Place
We've created the ultimate portfolio companion for stock investors, and it's free.
• Connect an unlimited number of Portfolios and see your total in one currency
• Be alerted to new Warning Signs or Risks via email or mobile
• Track the Fair Value of your stocks
This article by Simply Wall St is general in nature. It does not constitute a recommendation to buy or sell any stock, and does not take account of your objectives, or your financial situation. We aim to bring you long-term focused analysis driven by fundamental data. Note that our analysis may not factor in the latest price-sensitive company announcements or qualitative material. Simply Wall St has no position in any stocks mentioned.
*Interactive Brokers Rated Lowest Cost Broker by StockBrokers.com Annual Online Review 2020
Have feedback on this article? Concerned about the content? Get in touch with us directly. Alternatively, email editorial-team (at) simplywallst.com.
About TWSE:3023
SINBON Electronics
Manufactures and sells computer peripherals, connectors, wires, and other parts in Mainland China, Hong Kong, the United States, Taiwan, and internationally.
Flawless balance sheet, good value and pays a dividend.
Market Insights

Advertisement
Community Narratives
MicroVision will explode future revenue by 380.37% with a vision towards success
Fair Value US$60.00|98.5% undervalued
TH
Community Contributor
The Indispensable Artery for a New North American Economy
Fair Value CA$132.87|2.3% undervalued
TI
Community Contributor