- Taiwan
- /
- Communications
- /
- TPEX:6220
Shareholders Of YFC-Boneagle Electric (GTSM:6220) Must Be Happy With Their 137% Total Return

Generally speaking the aim of active stock picking is to find companies that provide returns that are superior to the market average. And while active stock picking involves risks (and requires diversification) it can also provide excess returns. To wit, the YFC-Boneagle Electric share price has climbed 83% in five years, easily topping the market return of 60% (ignoring dividends). However, more recent returns haven't been as impressive as that, with the stock returning just 11% in the last year , including dividends .
Check out our latest analysis for YFC-Boneagle Electric
While the efficient markets hypothesis continues to be taught by some, it has been proven that markets are over-reactive dynamic systems, and investors are not always rational. One flawed but reasonable way to assess how sentiment around a company has changed is to compare the earnings per share (EPS) with the share price.
During five years of share price growth, YFC-Boneagle Electric achieved compound earnings per share (EPS) growth of 3.8% per year. This EPS growth is lower than the 13% average annual increase in the share price. This suggests that market participants hold the company in higher regard, these days. That's not necessarily surprising considering the five-year track record of earnings growth.
The graphic below depicts how EPS has changed over time (unveil the exact values by clicking on the image).
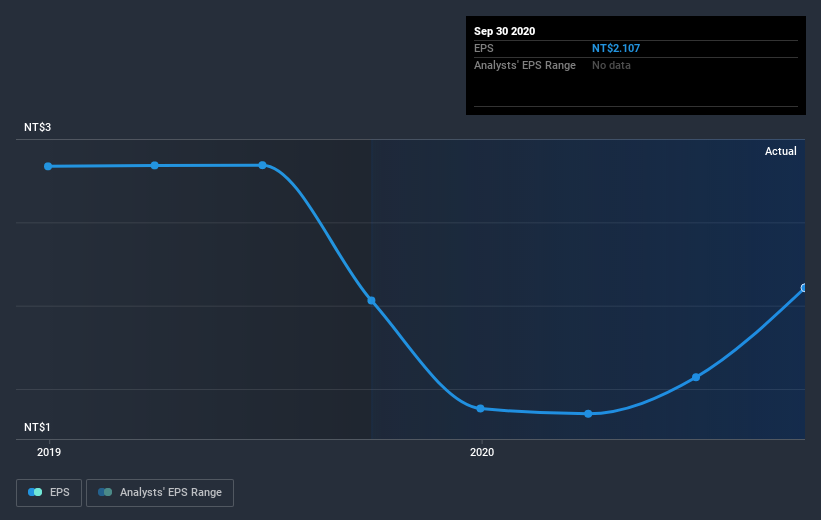
This free interactive report on YFC-Boneagle Electric's earnings, revenue and cash flow is a great place to start, if you want to investigate the stock further.
What About Dividends?
When looking at investment returns, it is important to consider the difference between total shareholder return (TSR) and share price return. Whereas the share price return only reflects the change in the share price, the TSR includes the value of dividends (assuming they were reinvested) and the benefit of any discounted capital raising or spin-off. Arguably, the TSR gives a more comprehensive picture of the return generated by a stock. In the case of YFC-Boneagle Electric, it has a TSR of 137% for the last 5 years. That exceeds its share price return that we previously mentioned. The dividends paid by the company have thusly boosted the total shareholder return.
A Different Perspective
YFC-Boneagle Electric shareholders are up 11% for the year (even including dividends). But that return falls short of the market. On the bright side, the longer term returns (running at about 19% a year, over half a decade) look better. Maybe the share price is just taking a breather while the business executes on its growth strategy. While it is well worth considering the different impacts that market conditions can have on the share price, there are other factors that are even more important. Like risks, for instance. Every company has them, and we've spotted 3 warning signs for YFC-Boneagle Electric (of which 1 makes us a bit uncomfortable!) you should know about.
If you like to buy stocks alongside management, then you might just love this free list of companies. (Hint: insiders have been buying them).
Please note, the market returns quoted in this article reflect the market weighted average returns of stocks that currently trade on TW exchanges.
When trading YFC-Boneagle Electric or any other investment, use the platform considered by many to be the Professional's Gateway to the Worlds Market, Interactive Brokers. You get the lowest-cost* trading on stocks, options, futures, forex, bonds and funds worldwide from a single integrated account. Promoted
Mobile Infrastructure for Defense and Disaster
The next wave in robotics isn't humanoid. Its fully autonomous towers delivering 5G, ISR, and radar in under 30 minutes, anywhere.
Get the investor briefing before the next round of contracts
Sponsored On Behalf of CiTechNew: Manage All Your Stock Portfolios in One Place
We've created the ultimate portfolio companion for stock investors, and it's free.
• Connect an unlimited number of Portfolios and see your total in one currency
• Be alerted to new Warning Signs or Risks via email or mobile
• Track the Fair Value of your stocks
This article by Simply Wall St is general in nature. It does not constitute a recommendation to buy or sell any stock, and does not take account of your objectives, or your financial situation. We aim to bring you long-term focused analysis driven by fundamental data. Note that our analysis may not factor in the latest price-sensitive company announcements or qualitative material. Simply Wall St has no position in any stocks mentioned.
*Interactive Brokers Rated Lowest Cost Broker by StockBrokers.com Annual Online Review 2020
Have feedback on this article? Concerned about the content? Get in touch with us directly. Alternatively, email editorial-team@simplywallst.com.
About TPEX:6220
YFC-Boneagle Electric
Provides power cord sets, LAN cables, patch cords, and networking accessories in Taiwan and internationally.
Adequate balance sheet average dividend payer.
Similar Companies
Market Insights

Weekly Picks

Early mover in a fast growing industry. Likely to experience share price volatility as they scale


A case for CA$31.80 (undiluted), aka 8,616% upside from CA$0.37 (an 86 bagger!).


Moderation and Stabilisation: HOLD: Fair Price based on a 4-year Cycle is $12.08
Recently Updated Narratives

Airbnb Stock: Platform Growth in a World of Saturation and Scrutiny

Adobe Stock: AI-Fueled ARR Growth Pushes Guidance Higher, But Cost Pressures Loom

Thomson Reuters Stock: When Legal Intelligence Becomes Mission-Critical Infrastructure
Popular Narratives


Crazy Undervalued 42 Baggers Silver Play (Active & Running Mine)


NVDA: Expanding AI Demand Will Drive Major Data Center Investments Through 2026

The AI Infrastructure Giant Grows Into Its Valuation
Trending Discussion


