
Advertisement
Howard Marks put it nicely when he said that, rather than worrying about share price volatility, 'The possibility of permanent loss is the risk I worry about... and every practical investor I know worries about.' So it might be obvious that you need to consider debt, when you think about how risky any given stock is, because too much debt can sink a company. We note that JMC Electronics Co., Ltd. (TWSE:6552) does have debt on its balance sheet. But should shareholders be worried about its use of debt?
When Is Debt A Problem?
Generally speaking, debt only becomes a real problem when a company can't easily pay it off, either by raising capital or with its own cash flow. Part and parcel of capitalism is the process of 'creative destruction' where failed businesses are mercilessly liquidated by their bankers. While that is not too common, we often do see indebted companies permanently diluting shareholders because lenders force them to raise capital at a distressed price. Of course, plenty of companies use debt to fund growth, without any negative consequences. The first step when considering a company's debt levels is to consider its cash and debt together.
See our latest analysis for JMC Electronics
What Is JMC Electronics's Debt?
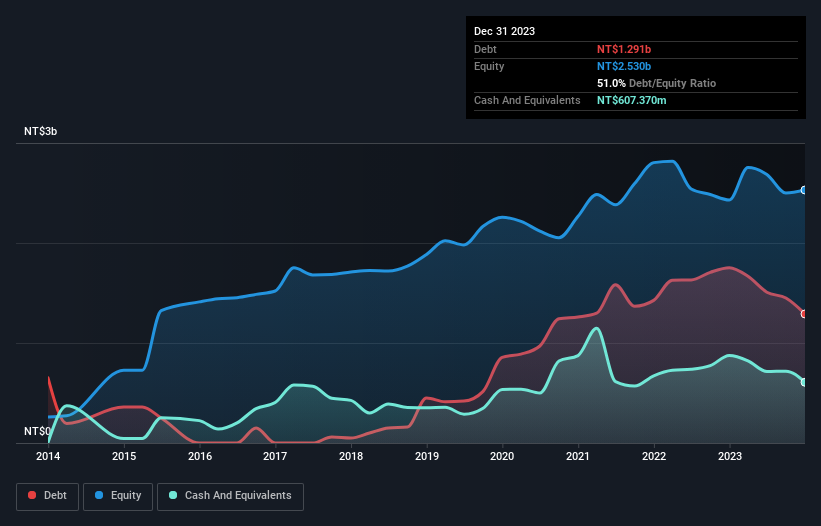
You can click the graphic below for the historical numbers, but it shows that JMC Electronics had NT$1.29b of debt in December 2023, down from NT$1.75b, one year before. However, it also had NT$607.4m in cash, and so its net debt is NT$683.2m.
How Healthy Is JMC Electronics' Balance Sheet?
According to the last reported balance sheet, JMC Electronics had liabilities of NT$1.15b due within 12 months, and liabilities of NT$573.4m due beyond 12 months. On the other hand, it had cash of NT$607.4m and NT$301.6m worth of receivables due within a year. So it has liabilities totalling NT$813.6m more than its cash and near-term receivables, combined.
Given JMC Electronics has a market capitalization of NT$4.53b, it's hard to believe these liabilities pose much threat. Having said that, it's clear that we should continue to monitor its balance sheet, lest it change for the worse. When analysing debt levels, the balance sheet is the obvious place to start. But you can't view debt in total isolation; since JMC Electronics will need earnings to service that debt. So if you're keen to discover more about its earnings, it might be worth checking out this graph of its long term earnings trend.
Over 12 months, JMC Electronics made a loss at the EBIT level, and saw its revenue drop to NT$1.8b, which is a fall of 16%. We would much prefer see growth.
Caveat Emptor
While JMC Electronics's falling revenue is about as heartwarming as a wet blanket, arguably its earnings before interest and tax (EBIT) loss is even less appealing. Indeed, it lost NT$102m at the EBIT level. When we look at that and recall the liabilities on its balance sheet, relative to cash, it seems unwise to us for the company to have any debt. Quite frankly we think the balance sheet is far from match-fit, although it could be improved with time. On the bright side, we note that trailing twelve month EBIT is worse than the free cash flow of NT$271m and the profit of NT$7.5m. So if we focus on those metrics there seems to be a chance the company will manage its debt without much trouble. There's no doubt that we learn most about debt from the balance sheet. However, not all investment risk resides within the balance sheet - far from it. We've identified 3 warning signs with JMC Electronics (at least 1 which is significant) , and understanding them should be part of your investment process.
When all is said and done, sometimes its easier to focus on companies that don't even need debt. Readers can access a list of growth stocks with zero net debt 100% free, right now.
New: Manage All Your Stock Portfolios in One Place
We've created the ultimate portfolio companion for stock investors, and it's free.
• Connect an unlimited number of Portfolios and see your total in one currency
• Be alerted to new Warning Signs or Risks via email or mobile
• Track the Fair Value of your stocks
Have feedback on this article? Concerned about the content? Get in touch with us directly. Alternatively, email editorial-team (at) simplywallst.com.
This article by Simply Wall St is general in nature. We provide commentary based on historical data and analyst forecasts only using an unbiased methodology and our articles are not intended to be financial advice. It does not constitute a recommendation to buy or sell any stock, and does not take account of your objectives, or your financial situation. We aim to bring you long-term focused analysis driven by fundamental data. Note that our analysis may not factor in the latest price-sensitive company announcements or qualitative material. Simply Wall St has no position in any stocks mentioned.
About TWSE:6552
JMC Electronics
Manufactures, processes, and trades chip on film (tape-COF) in Taiwan and Asia.
Adequate balance sheet and slightly overvalued.
Market Insights

Advertisement
Community Narratives
MINISO's fair value is projected at 26.69 with an anticipated PE ratio shift of 20x
Fair Value US$24.03|11.0% undervalued
BE
Community Contributor
Procter & Gamble: A Dividend Giant Facing Slowing Growth
Fair Value US$119.81|23.3% overvalued
AN
Community Contributor
Eli Lilly's Future Growth Driven by Tirzepatide and Favorable Market Conditions
Fair Value US$1.19k|13.8% undervalued
EA
Community Contributor