
Advertisement
- Taiwan
- /
- Semiconductors
- /
- TWSE:5434
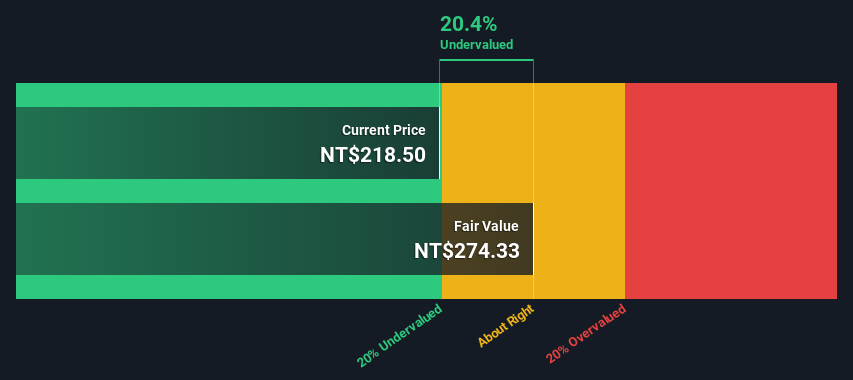
Are Investors Undervaluing Topco Scientific Co.,Ltd. (TWSE:5434) By 20%?
Key Insights
- Using the 2 Stage Free Cash Flow to Equity, Topco ScientificLtd fair value estimate is NT$274
- Topco ScientificLtd's NT$219 share price signals that it might be 20% undervalued
- Topco ScientificLtd's peers are currently trading at a premium of 143% on average
How far off is Topco Scientific Co.,Ltd. (TWSE:5434) from its intrinsic value? Using the most recent financial data, we'll take a look at whether the stock is fairly priced by taking the forecast future cash flows of the company and discounting them back to today's value. The Discounted Cash Flow (DCF) model is the tool we will apply to do this. Believe it or not, it's not too difficult to follow, as you'll see from our example!
Remember though, that there are many ways to estimate a company's value, and a DCF is just one method. If you still have some burning questions about this type of valuation, take a look at the Simply Wall St analysis model.
Check out our latest analysis for Topco ScientificLtd
Crunching The Numbers
We are going to use a two-stage DCF model, which, as the name states, takes into account two stages of growth. The first stage is generally a higher growth period which levels off heading towards the terminal value, captured in the second 'steady growth' period. In the first stage we need to estimate the cash flows to the business over the next ten years. Where possible we use analyst estimates, but when these aren't available we extrapolate the previous free cash flow (FCF) from the last estimate or reported value. We assume companies with shrinking free cash flow will slow their rate of shrinkage, and that companies with growing free cash flow will see their growth rate slow, over this period. We do this to reflect that growth tends to slow more in the early years than it does in later years.
A DCF is all about the idea that a dollar in the future is less valuable than a dollar today, so we discount the value of these future cash flows to their estimated value in today's dollars:
10-year free cash flow (FCF) estimate
| 2024 | 2025 | 2026 | 2027 | 2028 | 2029 | 2030 | 2031 | 2032 | 2033 | |
| Levered FCF (NT$, Millions) | NT$3.26b | NT$3.59b | NT$3.83b | NT$4.01b | NT$4.15b | NT$4.27b | NT$4.36b | NT$4.44b | NT$4.50b | NT$4.56b |
| Growth Rate Estimate Source | Analyst x1 | Analyst x1 | Est @ 6.47% | Est @ 4.77% | Est @ 3.59% | Est @ 2.76% | Est @ 2.18% | Est @ 1.77% | Est @ 1.48% | Est @ 1.29% |
| Present Value (NT$, Millions) Discounted @ 8.6% | NT$3.0k | NT$3.0k | NT$3.0k | NT$2.9k | NT$2.7k | NT$2.6k | NT$2.4k | NT$2.3k | NT$2.1k | NT$2.0k |
("Est" = FCF growth rate estimated by Simply Wall St)
Present Value of 10-year Cash Flow (PVCF) = NT$26b
The second stage is also known as Terminal Value, this is the business's cash flow after the first stage. The Gordon Growth formula is used to calculate Terminal Value at a future annual growth rate equal to the 5-year average of the 10-year government bond yield of 0.8%. We discount the terminal cash flows to today's value at a cost of equity of 8.6%.
Terminal Value (TV)= FCF2033 × (1 + g) ÷ (r – g) = NT$4.6b× (1 + 0.8%) ÷ (8.6%– 0.8%) = NT$59b
Present Value of Terminal Value (PVTV)= TV / (1 + r)10= NT$59b÷ ( 1 + 8.6%)10= NT$26b
The total value, or equity value, is then the sum of the present value of the future cash flows, which in this case is NT$52b. To get the intrinsic value per share, we divide this by the total number of shares outstanding. Relative to the current share price of NT$219, the company appears a touch undervalued at a 20% discount to where the stock price trades currently. The assumptions in any calculation have a big impact on the valuation, so it is better to view this as a rough estimate, not precise down to the last cent.
The Assumptions
We would point out that the most important inputs to a discounted cash flow are the discount rate and of course the actual cash flows. You don't have to agree with these inputs, I recommend redoing the calculations yourself and playing with them. The DCF also does not consider the possible cyclicality of an industry, or a company's future capital requirements, so it does not give a full picture of a company's potential performance. Given that we are looking at Topco ScientificLtd as potential shareholders, the cost of equity is used as the discount rate, rather than the cost of capital (or weighted average cost of capital, WACC) which accounts for debt. In this calculation we've used 8.6%, which is based on a levered beta of 1.427. Beta is a measure of a stock's volatility, compared to the market as a whole. We get our beta from the industry average beta of globally comparable companies, with an imposed limit between 0.8 and 2.0, which is a reasonable range for a stable business.
SWOT Analysis for Topco ScientificLtd
Strength
- Debt is not viewed as a risk.
Weakness
- Earnings declined over the past year.
- Dividend is low compared to the top 25% of dividend payers in the Semiconductor market.
- Shareholders have been diluted in the past year.
Opportunity
- Annual revenue is forecast to grow faster than the Taiwanese market.
- Good value based on P/E ratio and estimated fair value.
Threat
- Paying a dividend but company has no free cash flows.
Next Steps:
Valuation is only one side of the coin in terms of building your investment thesis, and it ideally won't be the sole piece of analysis you scrutinize for a company. It's not possible to obtain a foolproof valuation with a DCF model. Preferably you'd apply different cases and assumptions and see how they would impact the company's valuation. For instance, if the terminal value growth rate is adjusted slightly, it can dramatically alter the overall result. Why is the intrinsic value higher than the current share price? For Topco ScientificLtd, we've put together three fundamental items you should consider:
- Risks: Be aware that Topco ScientificLtd is showing 3 warning signs in our investment analysis , and 1 of those shouldn't be ignored...
- Future Earnings: How does 5434's growth rate compare to its peers and the wider market? Dig deeper into the analyst consensus number for the upcoming years by interacting with our free analyst growth expectation chart.
- Other Solid Businesses: Low debt, high returns on equity and good past performance are fundamental to a strong business. Why not explore our interactive list of stocks with solid business fundamentals to see if there are other companies you may not have considered!
PS. The Simply Wall St app conducts a discounted cash flow valuation for every stock on the TWSE every day. If you want to find the calculation for other stocks just search here.
Valuation is complex, but we're here to simplify it.
Discover if Topco ScientificLtd might be undervalued or overvalued with our detailed analysis, featuring fair value estimates, potential risks, dividends, insider trades, and its financial condition.
Access Free AnalysisHave feedback on this article? Concerned about the content? Get in touch with us directly. Alternatively, email editorial-team (at) simplywallst.com.
This article by Simply Wall St is general in nature. We provide commentary based on historical data and analyst forecasts only using an unbiased methodology and our articles are not intended to be financial advice. It does not constitute a recommendation to buy or sell any stock, and does not take account of your objectives, or your financial situation. We aim to bring you long-term focused analysis driven by fundamental data. Note that our analysis may not factor in the latest price-sensitive company announcements or qualitative material. Simply Wall St has no position in any stocks mentioned.
About TWSE:5434
Topco ScientificLtd
Provides precision materials, manufacturing equipment, and components worldwide.
Flawless balance sheet with solid track record and pays a dividend.
Similar Companies
Market Insights

Advertisement
Community Narratives
MINISO's fair value is projected at 26.69 with an anticipated PE ratio shift of 20x
Fair Value US$24.03|9.0% undervalued
BE
Community Contributor
Procter & Gamble: A Dividend Giant Facing Slowing Growth
Fair Value US$119.81|23.5% overvalued
AN
Community Contributor
Eli Lilly's Future Growth Driven by Tirzepatide and Favorable Market Conditions
Fair Value US$1.19k|14.4% undervalued
EA
Community Contributor