
Advertisement
- Taiwan
- /
- Semiconductors
- /
- TWSE:3437
Advanced Optoelectronic Technology Inc. (TWSE:3437) Stock Catapults 30% Though Its Price And Business Still Lag The Industry
Advanced Optoelectronic Technology Inc. (TWSE:3437) shareholders are no doubt pleased to see that the share price has bounced 30% in the last month, although it is still struggling to make up recently lost ground. The last 30 days bring the annual gain to a very sharp 56%.
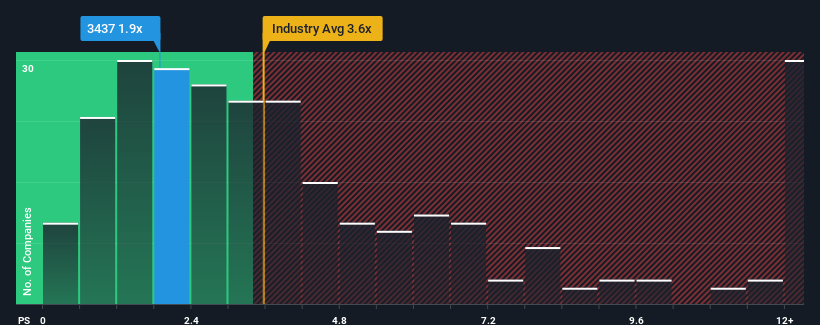
In spite of the firm bounce in price, Advanced Optoelectronic Technology's price-to-sales (or "P/S") ratio of 1.9x might still make it look like a buy right now compared to the Semiconductor industry in Taiwan, where around half of the companies have P/S ratios above 3.6x and even P/S above 7x are quite common. However, the P/S might be low for a reason and it requires further investigation to determine if it's justified.
View our latest analysis for Advanced Optoelectronic Technology
What Does Advanced Optoelectronic Technology's P/S Mean For Shareholders?
Revenue has risen firmly for Advanced Optoelectronic Technology recently, which is pleasing to see. It might be that many expect the respectable revenue performance to degrade substantially, which has repressed the P/S. If that doesn't eventuate, then existing shareholders have reason to be optimistic about the future direction of the share price.
Want the full picture on earnings, revenue and cash flow for the company? Then our free report on Advanced Optoelectronic Technology will help you shine a light on its historical performance.How Is Advanced Optoelectronic Technology's Revenue Growth Trending?
The only time you'd be truly comfortable seeing a P/S as low as Advanced Optoelectronic Technology's is when the company's growth is on track to lag the industry.
Taking a look back first, we see that the company grew revenue by an impressive 21% last year. However, this wasn't enough as the latest three year period has seen the company endure a nasty 62% drop in revenue in aggregate. Accordingly, shareholders would have felt downbeat about the medium-term rates of revenue growth.
Comparing that to the industry, which is predicted to deliver 26% growth in the next 12 months, the company's downward momentum based on recent medium-term revenue results is a sobering picture.
With this information, we are not surprised that Advanced Optoelectronic Technology is trading at a P/S lower than the industry. However, we think shrinking revenues are unlikely to lead to a stable P/S over the longer term, which could set up shareholders for future disappointment. There's potential for the P/S to fall to even lower levels if the company doesn't improve its top-line growth.
What Does Advanced Optoelectronic Technology's P/S Mean For Investors?
Despite Advanced Optoelectronic Technology's share price climbing recently, its P/S still lags most other companies. Using the price-to-sales ratio alone to determine if you should sell your stock isn't sensible, however it can be a practical guide to the company's future prospects.
Our examination of Advanced Optoelectronic Technology confirms that the company's shrinking revenue over the past medium-term is a key factor in its low price-to-sales ratio, given the industry is projected to grow. Right now shareholders are accepting the low P/S as they concede future revenue probably won't provide any pleasant surprises either. If recent medium-term revenue trends continue, it's hard to see the share price moving strongly in either direction in the near future under these circumstances.
You always need to take note of risks, for example - Advanced Optoelectronic Technology has 1 warning sign we think you should be aware of.
It's important to make sure you look for a great company, not just the first idea you come across. So if growing profitability aligns with your idea of a great company, take a peek at this free list of interesting companies with strong recent earnings growth (and a low P/E).
New: Manage All Your Stock Portfolios in One Place
We've created the ultimate portfolio companion for stock investors, and it's free.
• Connect an unlimited number of Portfolios and see your total in one currency
• Be alerted to new Warning Signs or Risks via email or mobile
• Track the Fair Value of your stocks
Have feedback on this article? Concerned about the content? Get in touch with us directly. Alternatively, email editorial-team (at) simplywallst.com.
This article by Simply Wall St is general in nature. We provide commentary based on historical data and analyst forecasts only using an unbiased methodology and our articles are not intended to be financial advice. It does not constitute a recommendation to buy or sell any stock, and does not take account of your objectives, or your financial situation. We aim to bring you long-term focused analysis driven by fundamental data. Note that our analysis may not factor in the latest price-sensitive company announcements or qualitative material. Simply Wall St has no position in any stocks mentioned.
About TWSE:3437
Advanced Optoelectronic Technology
Focuses on the development of LED packaging technology in Taiwan.
Flawless balance sheet and slightly overvalued.
Similar Companies
Market Insights

Advertisement
Community Narratives
MINISO's fair value is projected at 26.69 with an anticipated PE ratio shift of 20x
Fair Value US$24.03|11.0% undervalued
BE
Community Contributor
Procter & Gamble: A Dividend Giant Facing Slowing Growth
Fair Value US$119.81|23.3% overvalued
AN
Community Contributor
Eli Lilly's Future Growth Driven by Tirzepatide and Favorable Market Conditions
Fair Value US$1.19k|13.8% undervalued
EA
Community Contributor