
Advertisement
- Taiwan
- /
- Semiconductors
- /
- TWSE:6706
Is Fittech Co.,Ltd's (TPE:6706) Stock's Recent Performance Being Led By Its Attractive Financial Prospects?
FittechLtd's (TPE:6706) stock is up by a considerable 11% over the past three months. Given that the market rewards strong financials in the long-term, we wonder if that is the case in this instance. Specifically, we decided to study FittechLtd's ROE in this article.
ROE or return on equity is a useful tool to assess how effectively a company can generate returns on the investment it received from its shareholders. In other words, it is a profitability ratio which measures the rate of return on the capital provided by the company's shareholders.
View our latest analysis for FittechLtd
How Is ROE Calculated?
The formula for ROE is:
Return on Equity = Net Profit (from continuing operations) ÷ Shareholders' Equity
So, based on the above formula, the ROE for FittechLtd is:
9.8% = NT$219m ÷ NT$2.2b (Based on the trailing twelve months to September 2020).
The 'return' is the profit over the last twelve months. One way to conceptualize this is that for each NT$1 of shareholders' capital it has, the company made NT$0.10 in profit.
What Is The Relationship Between ROE And Earnings Growth?
So far, we've learned that ROE is a measure of a company's profitability. Depending on how much of these profits the company reinvests or "retains", and how effectively it does so, we are then able to assess a company’s earnings growth potential. Assuming all else is equal, companies that have both a higher return on equity and higher profit retention are usually the ones that have a higher growth rate when compared to companies that don't have the same features.
FittechLtd's Earnings Growth And 9.8% ROE
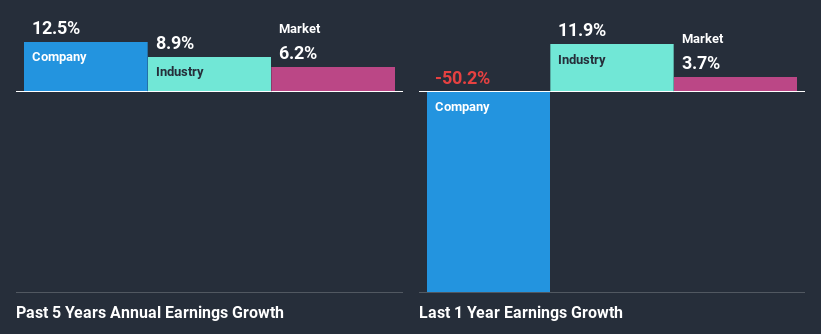
To start with, FittechLtd's ROE looks acceptable. Even when compared to the industry average of 11% the company's ROE looks quite decent. This probably goes some way in explaining FittechLtd's moderate 13% growth over the past five years amongst other factors.
As a next step, we compared FittechLtd's net income growth with the industry, and pleasingly, we found that the growth seen by the company is higher than the average industry growth of 8.9%.
Earnings growth is a huge factor in stock valuation. The investor should try to establish if the expected growth or decline in earnings, whichever the case may be, is priced in. This then helps them determine if the stock is placed for a bright or bleak future. One good indicator of expected earnings growth is the P/E ratio which determines the price the market is willing to pay for a stock based on its earnings prospects. So, you may want to check if FittechLtd is trading on a high P/E or a low P/E, relative to its industry.
Is FittechLtd Using Its Retained Earnings Effectively?
FittechLtd has a significant three-year median payout ratio of 65%, meaning that it is left with only 35% to reinvest into its business. This implies that the company has been able to achieve decent earnings growth despite returning most of its profits to shareholders.
While FittechLtd has been growing its earnings, it only recently started to pay dividends which likely means that the company decided to impress new and existing shareholders with a dividend.
Conclusion
Overall, we are quite pleased with FittechLtd's performance. Especially the high ROE, Which has contributed to the impressive growth seen in earnings. Despite the company reinvesting only a small portion of its profits, it still has managed to grow its earnings so that is appreciable. Until now, we have only just grazed the surface of the company's past performance by looking at the company's fundamentals. You can do your own research on FittechLtd and see how it has performed in the past by looking at this FREE detailed graph of past earnings, revenue and cash flows.
If you’re looking to trade FittechLtd, open an account with the lowest-cost* platform trusted by professionals, Interactive Brokers. Their clients from over 200 countries and territories trade stocks, options, futures, forex, bonds and funds worldwide from a single integrated account. Promoted
New: AI Stock Screener & Alerts
Our new AI Stock Screener scans the market every day to uncover opportunities.
• Dividend Powerhouses (3%+ Yield)
• Undervalued Small Caps with Insider Buying
• High growth Tech and AI Companies
Or build your own from over 50 metrics.
This article by Simply Wall St is general in nature. It does not constitute a recommendation to buy or sell any stock, and does not take account of your objectives, or your financial situation. We aim to bring you long-term focused analysis driven by fundamental data. Note that our analysis may not factor in the latest price-sensitive company announcements or qualitative material. Simply Wall St has no position in any stocks mentioned.
*Interactive Brokers Rated Lowest Cost Broker by StockBrokers.com Annual Online Review 2020
Have feedback on this article? Concerned about the content? Get in touch with us directly. Alternatively, email editorial-team (at) simplywallst.com.
About TWSE:6706
Fittech
Provides automatic equipment and system integration services in Taiwan and internationally.
Mediocre balance sheet with very low risk.
Similar Companies
Market Insights

Advertisement
Community Narratives
MicroVision will explode future revenue by 380.37% with a vision towards success
Fair Value US$60|98.4% undervalued
TH
Community Contributor
The Indispensable Artery for a New North American Economy
Fair Value CA$132.87|1.6% undervalued
TI
Community Contributor
Recently Updated Narratives
BE


Bejgal on MINISO Group Holding ·
MINISO's fair value is projected at 26.69 with an anticipated PE ratio shift of 20x
Fair Value:US$26.6928.0% undervalued
44 followersusers have followed this narrative
3 commentsusers have commented on this narrative
0 likesusers have liked this narrative
TI


TickerTickle on Oracle ·
The Quiet Giant That Became AI’s Power Grid
Fair Value:US$389.8149.5% undervalued
7 followersusers have followed this narrative
0 commentsusers have commented on this narrative
0 likesusers have liked this narrative
AU

AuCA on Nova Ljubljanska Banka d.d ·
Nova Ljubljanska Banka d.d will expect a 11.2% revenue boost driving future growth
Fair Value:€20916.3% undervalued
23 followersusers have followed this narrative
3 commentsusers have commented on this narrative
0 likesusers have liked this narrative
Popular Narratives
OS


oscargarcia on Alphabet ·
The company that turned a verb into a global necessity and basically runs the modern internet, digital ads, smartphones, maps, and AI.
Fair Value:US$3404.9% undervalued
134 followersusers have followed this narrative
6 commentsusers have commented on this narrative
18 likesusers have liked this narrative
TH

TheWallstreetKing on MicroVision ·
MicroVision will explode future revenue by 380.37% with a vision towards success
Fair Value:US$6098.4% undervalued
83 followersusers have followed this narrative
10 commentsusers have commented on this narrative
18 likesusers have liked this narrative
AN


AnalystConsensusTarget on NVIDIA ·
NVDA: Expanding AI Demand Will Drive Major Data Center Investments Through 2026
Fair Value:US$232.7923.6% undervalued
919 followersusers have followed this narrative
5 commentsusers have commented on this narrative
21 likesusers have liked this narrative