
Advertisement
- Taiwan
- /
- Semiconductors
- /
- TPEX:8064
The Trends At Contrel Technology (GTSM:8064) That You Should Know About
If you're looking for a multi-bagger, there's a few things to keep an eye out for. One common approach is to try and find a company with returns on capital employed (ROCE) that are increasing, in conjunction with a growing amount of capital employed. Basically this means that a company has profitable initiatives that it can continue to reinvest in, which is a trait of a compounding machine. Having said that, from a first glance at Contrel Technology (GTSM:8064) we aren't jumping out of our chairs at how returns are trending, but let's have a deeper look.
Understanding Return On Capital Employed (ROCE)
If you haven't worked with ROCE before, it measures the 'return' (pre-tax profit) a company generates from capital employed in its business. Analysts use this formula to calculate it for Contrel Technology:
Return on Capital Employed = Earnings Before Interest and Tax (EBIT) ÷ (Total Assets - Current Liabilities)
0.012 = NT$40m ÷ (NT$7.9b - NT$4.6b) (Based on the trailing twelve months to September 2020).
Therefore, Contrel Technology has an ROCE of 1.2%. Ultimately, that's a low return and it under-performs the Semiconductor industry average of 11%.
See our latest analysis for Contrel Technology
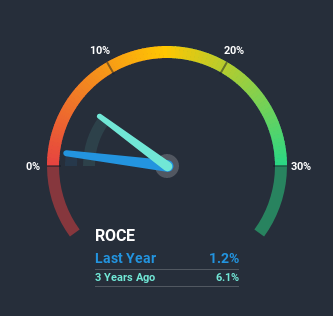
Historical performance is a great place to start when researching a stock so above you can see the gauge for Contrel Technology's ROCE against it's prior returns. If you'd like to look at how Contrel Technology has performed in the past in other metrics, you can view this free graph of past earnings, revenue and cash flow.
How Are Returns Trending?
When we looked at the ROCE trend at Contrel Technology, we didn't gain much confidence. Around five years ago the returns on capital were 1.7%, but since then they've fallen to 1.2%. Given the business is employing more capital while revenue has slipped, this is a bit concerning. If this were to continue, you might be looking at a company that is trying to reinvest for growth but is actually losing market share since sales haven't increased.
Another thing to note, Contrel Technology has a high ratio of current liabilities to total assets of 58%. This effectively means that suppliers (or short-term creditors) are funding a large portion of the business, so just be aware that this can introduce some elements of risk. While it's not necessarily a bad thing, it can be beneficial if this ratio is lower.
The Key Takeaway
From the above analysis, we find it rather worrisome that returns on capital and sales for Contrel Technology have fallen, meanwhile the business is employing more capital than it was five years ago. Yet despite these concerning fundamentals, the stock has performed strongly with a 47% return over the last five years, so investors appear very optimistic. In any case, the current underlying trends don't bode well for long term performance so unless they reverse, we'd start looking elsewhere.
If you want to know some of the risks facing Contrel Technology we've found 3 warning signs (1 is concerning!) that you should be aware of before investing here.
If you want to search for solid companies with great earnings, check out this free list of companies with good balance sheets and impressive returns on equity.
If you’re looking to trade Contrel Technology, open an account with the lowest-cost* platform trusted by professionals, Interactive Brokers. Their clients from over 200 countries and territories trade stocks, options, futures, forex, bonds and funds worldwide from a single integrated account. Promoted
New: AI Stock Screener & Alerts
Our new AI Stock Screener scans the market every day to uncover opportunities.
• Dividend Powerhouses (3%+ Yield)
• Undervalued Small Caps with Insider Buying
• High growth Tech and AI Companies
Or build your own from over 50 metrics.
This article by Simply Wall St is general in nature. It does not constitute a recommendation to buy or sell any stock, and does not take account of your objectives, or your financial situation. We aim to bring you long-term focused analysis driven by fundamental data. Note that our analysis may not factor in the latest price-sensitive company announcements or qualitative material. Simply Wall St has no position in any stocks mentioned.
*Interactive Brokers Rated Lowest Cost Broker by StockBrokers.com Annual Online Review 2020
Have feedback on this article? Concerned about the content? Get in touch with us directly. Alternatively, email editorial-team (at) simplywallst.com.
About TPEX:8064
Contrel Technology
Researches, develops, manufactures, and sells LCD and related equipment in Taiwan.
Excellent balance sheet and fair value.
Similar Companies
Market Insights

Advertisement
Community Narratives
The company that turned a verb into a global necessity and basically runs the modern internet, digital ads, smartphones, maps, and AI.
Fair Value US$300.00|6.3% undervalued
OS
Community Contributor
Flowers Foods Pays A Fair Price For Health
Fair Value US$16.12|26.0% undervalued
NV
Community Contributor
TMX Group will thrive with 33.3% profit margin and enduring market moat
Fair Value CA$49.90|3.7% overvalued
LI
Community Contributor