
Advertisement
- Taiwan
- /
- Basic Materials
- /
- TWSE:8463
Ruentex MaterialsLtd (TWSE:8463) Is Experiencing Growth In Returns On Capital
There are a few key trends to look for if we want to identify the next multi-bagger. In a perfect world, we'd like to see a company investing more capital into its business and ideally the returns earned from that capital are also increasing. This shows us that it's a compounding machine, able to continually reinvest its earnings back into the business and generate higher returns. With that in mind, we've noticed some promising trends at Ruentex MaterialsLtd (TWSE:8463) so let's look a bit deeper.
Return On Capital Employed (ROCE): What Is It?
For those who don't know, ROCE is a measure of a company's yearly pre-tax profit (its return), relative to the capital employed in the business. The formula for this calculation on Ruentex MaterialsLtd is:
Return on Capital Employed = Earnings Before Interest and Tax (EBIT) ÷ (Total Assets - Current Liabilities)
0.056 = NT$290m ÷ (NT$7.4b - NT$2.3b) (Based on the trailing twelve months to December 2023).
Thus, Ruentex MaterialsLtd has an ROCE of 5.6%. In absolute terms, that's a low return and it also under-performs the Basic Materials industry average of 7.4%.
View our latest analysis for Ruentex MaterialsLtd
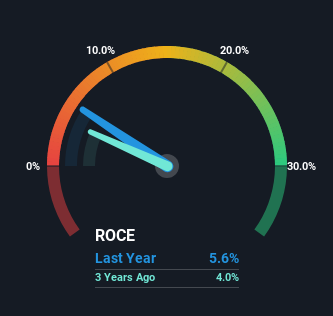
Historical performance is a great place to start when researching a stock so above you can see the gauge for Ruentex MaterialsLtd's ROCE against it's prior returns. If you'd like to look at how Ruentex MaterialsLtd has performed in the past in other metrics, you can view this free graph of Ruentex MaterialsLtd's past earnings, revenue and cash flow.
What Can We Tell From Ruentex MaterialsLtd's ROCE Trend?
While in absolute terms it isn't a high ROCE, it's promising to see that it has been moving in the right direction. The numbers show that in the last five years, the returns generated on capital employed have grown considerably to 5.6%. The company is effectively making more money per dollar of capital used, and it's worth noting that the amount of capital has increased too, by 41%. This can indicate that there's plenty of opportunities to invest capital internally and at ever higher rates, a combination that's common among multi-baggers.
On a side note, we noticed that the improvement in ROCE appears to be partly fueled by an increase in current liabilities. Essentially the business now has suppliers or short-term creditors funding about 30% of its operations, which isn't ideal. It's worth keeping an eye on this because as the percentage of current liabilities to total assets increases, some aspects of risk also increase.
In Conclusion...
All in all, it's terrific to see that Ruentex MaterialsLtd is reaping the rewards from prior investments and is growing its capital base. Investors may not be impressed by the favorable underlying trends yet because over the last five years the stock has only returned 18% to shareholders. So exploring more about this stock could uncover a good opportunity, if the valuation and other metrics stack up.
One more thing: We've identified 3 warning signs with Ruentex MaterialsLtd (at least 2 which make us uncomfortable) , and understanding these would certainly be useful.
For those who like to invest in solid companies, check out this free list of companies with solid balance sheets and high returns on equity.
New: AI Stock Screener & Alerts
Our new AI Stock Screener scans the market every day to uncover opportunities.
• Dividend Powerhouses (3%+ Yield)
• Undervalued Small Caps with Insider Buying
• High growth Tech and AI Companies
Or build your own from over 50 metrics.
Have feedback on this article? Concerned about the content? Get in touch with us directly. Alternatively, email editorial-team (at) simplywallst.com.
This article by Simply Wall St is general in nature. We provide commentary based on historical data and analyst forecasts only using an unbiased methodology and our articles are not intended to be financial advice. It does not constitute a recommendation to buy or sell any stock, and does not take account of your objectives, or your financial situation. We aim to bring you long-term focused analysis driven by fundamental data. Note that our analysis may not factor in the latest price-sensitive company announcements or qualitative material. Simply Wall St has no position in any stocks mentioned.
About TWSE:8463
Ruentex MaterialsLtd
Engages in the cement, building materials, and engineering and construction businesses in Taiwan.
Solid track record and good value.
Similar Companies
Market Insights

Advertisement
Community Narratives
The company that turned a verb into a global necessity and basically runs the modern internet, digital ads, smartphones, maps, and AI.
Fair Value US$300.00|7.5% undervalued
OS
Community Contributor
Flowers Foods Pays A Fair Price For Health
Fair Value US$16.12|25.4% undervalued
NV
Community Contributor
TMX Group will thrive with 33.3% profit margin and enduring market moat
Fair Value CA$49.90|3.6% overvalued
LI
Community Contributor
The "Molecular Pencil": Why Beam's Technology is Built to Win
Fair Value US$65.01|65.0% undervalued
DA
Community Contributor