
Advertisement
Tex Year Industries Inc. (TWSE:4720) Held Back By Insufficient Growth Even After Shares Climb 29%
Despite an already strong run, Tex Year Industries Inc. (TWSE:4720) shares have been powering on, with a gain of 29% in the last thirty days. Looking back a bit further, it's encouraging to see the stock is up 61% in the last year.
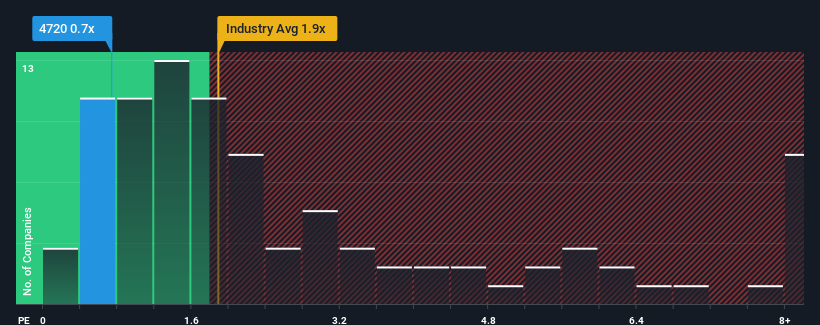
In spite of the firm bounce in price, Tex Year Industries may still be sending buy signals at present with its price-to-sales (or "P/S") ratio of 0.7x, considering almost half of all companies in the Chemicals industry in Taiwan have P/S ratios greater than 1.9x and even P/S higher than 4x aren't out of the ordinary. However, the P/S might be low for a reason and it requires further investigation to determine if it's justified.
View our latest analysis for Tex Year Industries
How Has Tex Year Industries Performed Recently?
For instance, Tex Year Industries' receding revenue in recent times would have to be some food for thought. Perhaps the market believes the recent revenue performance isn't good enough to keep up the industry, causing the P/S ratio to suffer. If you like the company, you'd be hoping this isn't the case so that you could potentially pick up some stock while it's out of favour.
Want the full picture on earnings, revenue and cash flow for the company? Then our free report on Tex Year Industries will help you shine a light on its historical performance.Do Revenue Forecasts Match The Low P/S Ratio?
In order to justify its P/S ratio, Tex Year Industries would need to produce sluggish growth that's trailing the industry.
Retrospectively, the last year delivered a frustrating 3.4% decrease to the company's top line. Unfortunately, that's brought it right back to where it started three years ago with revenue growth being virtually non-existent overall during that time. Therefore, it's fair to say that revenue growth has been inconsistent recently for the company.
Comparing the recent medium-term revenue trends against the industry's one-year growth forecast of 7.6% shows it's noticeably less attractive.
With this in consideration, it's easy to understand why Tex Year Industries' P/S falls short of the mark set by its industry peers. It seems most investors are expecting to see the recent limited growth rates continue into the future and are only willing to pay a reduced amount for the stock.
The Final Word
Despite Tex Year Industries' share price climbing recently, its P/S still lags most other companies. While the price-to-sales ratio shouldn't be the defining factor in whether you buy a stock or not, it's quite a capable barometer of revenue expectations.
In line with expectations, Tex Year Industries maintains its low P/S on the weakness of its recent three-year growth being lower than the wider industry forecast. Right now shareholders are accepting the low P/S as they concede future revenue probably won't provide any pleasant surprises. Unless the recent medium-term conditions improve, they will continue to form a barrier for the share price around these levels.
There are also other vital risk factors to consider before investing and we've discovered 3 warning signs for Tex Year Industries that you should be aware of.
If strong companies turning a profit tickle your fancy, then you'll want to check out this free list of interesting companies that trade on a low P/E (but have proven they can grow earnings).
Valuation is complex, but we're here to simplify it.
Discover if Tex Year Industries might be undervalued or overvalued with our detailed analysis, featuring fair value estimates, potential risks, dividends, insider trades, and its financial condition.
Access Free AnalysisHave feedback on this article? Concerned about the content? Get in touch with us directly. Alternatively, email editorial-team (at) simplywallst.com.
This article by Simply Wall St is general in nature. We provide commentary based on historical data and analyst forecasts only using an unbiased methodology and our articles are not intended to be financial advice. It does not constitute a recommendation to buy or sell any stock, and does not take account of your objectives, or your financial situation. We aim to bring you long-term focused analysis driven by fundamental data. Note that our analysis may not factor in the latest price-sensitive company announcements or qualitative material. Simply Wall St has no position in any stocks mentioned.
Have feedback on this article? Concerned about the content? Get in touch with us directly. Alternatively, email editorial-team@simplywallst.com
About TWSE:4720
Tex Year Industries
Manufactures and trades in viscose, adhesives, and hot-melt adhesives in Taiwan, Asia, Europe, the United States, and internationally.
Excellent balance sheet second-rate dividend payer.
Market Insights

Advertisement
Community Narratives
Finding The True Value Of A Logistics Powerhouse
Fair Value US$95.21|8.4% undervalued
NV
Community Contributor
Paradigm Biopharmaceuticals Will Lead Osteoarthritis Treatment with Zilosul's FDA Success
Fair Value AU$5.50|92.1% undervalued
AM
Community Contributor
Barrick Mining (ABX:CA): A Gold Hedge against a U.S. Shutdown
Fair Value CA$60.00|24.2% undervalued
GM
Community Contributor