
Advertisement
Returns At Tex Year Industries (TWSE:4720) Are On The Way Up
To find a multi-bagger stock, what are the underlying trends we should look for in a business? Amongst other things, we'll want to see two things; firstly, a growing return on capital employed (ROCE) and secondly, an expansion in the company's amount of capital employed. Put simply, these types of businesses are compounding machines, meaning they are continually reinvesting their earnings at ever-higher rates of return. So when we looked at Tex Year Industries (TWSE:4720) and its trend of ROCE, we really liked what we saw.
Return On Capital Employed (ROCE): What Is It?
For those that aren't sure what ROCE is, it measures the amount of pre-tax profits a company can generate from the capital employed in its business. To calculate this metric for Tex Year Industries, this is the formula:
Return on Capital Employed = Earnings Before Interest and Tax (EBIT) ÷ (Total Assets - Current Liabilities)
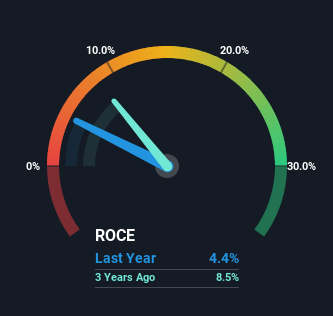
0.044 = NT$78m ÷ (NT$3.0b - NT$1.2b) (Based on the trailing twelve months to March 2024).
Therefore, Tex Year Industries has an ROCE of 4.4%. On its own, that's a low figure but it's around the 5.0% average generated by the Chemicals industry.
View our latest analysis for Tex Year Industries
While the past is not representative of the future, it can be helpful to know how a company has performed historically, which is why we have this chart above. If you'd like to look at how Tex Year Industries has performed in the past in other metrics, you can view this free graph of Tex Year Industries' past earnings, revenue and cash flow.
The Trend Of ROCE
While there are companies with higher returns on capital out there, we still find the trend at Tex Year Industries promising. Looking at the data, we can see that even though capital employed in the business has remained relatively flat, the ROCE generated has risen by 252% over the last five years. So our take on this is that the business has increased efficiencies to generate these higher returns, all the while not needing to make any additional investments. The company is doing well in that sense, and it's worth investigating what the management team has planned for long term growth prospects.
On a side note, Tex Year Industries' current liabilities are still rather high at 41% of total assets. This can bring about some risks because the company is basically operating with a rather large reliance on its suppliers or other sorts of short-term creditors. Ideally we'd like to see this reduce as that would mean fewer obligations bearing risks.
In Conclusion...
In summary, we're delighted to see that Tex Year Industries has been able to increase efficiencies and earn higher rates of return on the same amount of capital. And investors seem to expect more of this going forward, since the stock has rewarded shareholders with a 92% return over the last five years. In light of that, we think it's worth looking further into this stock because if Tex Year Industries can keep these trends up, it could have a bright future ahead.
If you want to continue researching Tex Year Industries, you might be interested to know about the 3 warning signs that our analysis has discovered.
If you want to search for solid companies with great earnings, check out this free list of companies with good balance sheets and impressive returns on equity.
Valuation is complex, but we're here to simplify it.
Discover if Tex Year Industries might be undervalued or overvalued with our detailed analysis, featuring fair value estimates, potential risks, dividends, insider trades, and its financial condition.
Access Free AnalysisHave feedback on this article? Concerned about the content? Get in touch with us directly. Alternatively, email editorial-team (at) simplywallst.com.
This article by Simply Wall St is general in nature. We provide commentary based on historical data and analyst forecasts only using an unbiased methodology and our articles are not intended to be financial advice. It does not constitute a recommendation to buy or sell any stock, and does not take account of your objectives, or your financial situation. We aim to bring you long-term focused analysis driven by fundamental data. Note that our analysis may not factor in the latest price-sensitive company announcements or qualitative material. Simply Wall St has no position in any stocks mentioned.
Have feedback on this article? Concerned about the content? Get in touch with us directly. Alternatively, email editorial-team@simplywallst.com
About TWSE:4720
Tex Year Industries
Manufactures and trades in viscose, adhesives, and hot-melt adhesives in Taiwan, Asia, Europe, the United States, and internationally.
Excellent balance sheet second-rate dividend payer.
Market Insights

Advertisement
Community Narratives
Finding The True Value Of A Logistics Powerhouse
Fair Value US$95.21|6.3% undervalued
NV
Community Contributor
Paradigm Biopharmaceuticals Will Lead Osteoarthritis Treatment with Zilosul's FDA Success
Fair Value AU$5.50|91.9% undervalued
AM
Community Contributor
Barrick Mining (ABX:CA): A Gold Hedge against a U.S. Shutdown
Fair Value CA$60.00|25.8% undervalued
GM
Community Contributor