
Advertisement
If You Had Bought Tex Year Industries (TPE:4720) Shares A Year Ago You'd Have Earned 49% Returns
We believe investing is smart because history shows that stock markets go higher in the long term. But if when you choose to buy stocks, some of them will be below average performers. Unfortunately for shareholders, while the Tex Year Industries Inc. (TPE:4720) share price is up 49% in the last year, that falls short of the market return. However, the stock hasn't done so well in the longer term, with the stock only up 11% in three years.
Check out our latest analysis for Tex Year Industries
While markets are a powerful pricing mechanism, share prices reflect investor sentiment, not just underlying business performance. One way to examine how market sentiment has changed over time is to look at the interaction between a company's share price and its earnings per share (EPS).
Over the last twelve months, Tex Year Industries actually shrank its EPS by 1.1%.
We don't think that the decline in earnings per share is a good measure of the business over the last twelve months. Since the change in EPS doesn't seem to correlate with the change in share price, it's worth taking a look at other metrics.
We doubt the modest 1.9% dividend yield is doing much to support the share price. Unfortunately Tex Year Industries' fell 5.2% over twelve months. So using a snapshot of key business metrics doesn't give us a good picture of why the market is bidding up the stock.
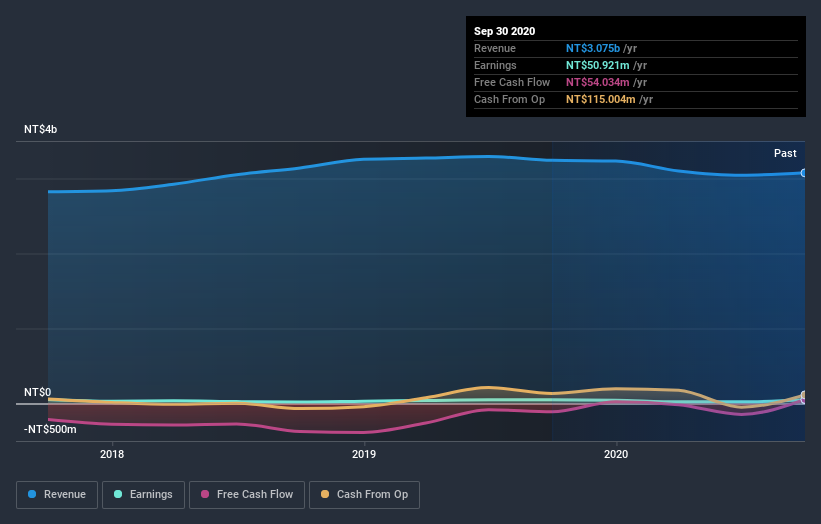
The company's revenue and earnings (over time) are depicted in the image below (click to see the exact numbers).
If you are thinking of buying or selling Tex Year Industries stock, you should check out this FREE detailed report on its balance sheet.
What About Dividends?
It is important to consider the total shareholder return, as well as the share price return, for any given stock. The TSR incorporates the value of any spin-offs or discounted capital raisings, along with any dividends, based on the assumption that the dividends are reinvested. So for companies that pay a generous dividend, the TSR is often a lot higher than the share price return. In the case of Tex Year Industries, it has a TSR of 52% for the last year. That exceeds its share price return that we previously mentioned. And there's no prize for guessing that the dividend payments largely explain the divergence!
A Different Perspective
Tex Year Industries shareholders are up 52% for the year (even including dividends). Unfortunately this falls short of the market return. On the bright side, that's still a gain, and it's actually better than the average return of 2% over half a decade This could indicate that the company is winning over new investors, as it pursues its strategy. I find it very interesting to look at share price over the long term as a proxy for business performance. But to truly gain insight, we need to consider other information, too. Even so, be aware that Tex Year Industries is showing 3 warning signs in our investment analysis , and 2 of those are significant...
Of course Tex Year Industries may not be the best stock to buy. So you may wish to see this free collection of growth stocks.
Please note, the market returns quoted in this article reflect the market weighted average returns of stocks that currently trade on TW exchanges.
If you’re looking to trade Tex Year Industries, open an account with the lowest-cost* platform trusted by professionals, Interactive Brokers. Their clients from over 200 countries and territories trade stocks, options, futures, forex, bonds and funds worldwide from a single integrated account. Promoted
Valuation is complex, but we're here to simplify it.
Discover if Tex Year Industries might be undervalued or overvalued with our detailed analysis, featuring fair value estimates, potential risks, dividends, insider trades, and its financial condition.
Access Free AnalysisThis article by Simply Wall St is general in nature. It does not constitute a recommendation to buy or sell any stock, and does not take account of your objectives, or your financial situation. We aim to bring you long-term focused analysis driven by fundamental data. Note that our analysis may not factor in the latest price-sensitive company announcements or qualitative material. Simply Wall St has no position in any stocks mentioned.
*Interactive Brokers Rated Lowest Cost Broker by StockBrokers.com Annual Online Review 2020
Have feedback on this article? Concerned about the content? Get in touch with us directly. Alternatively, email editorial-team (at) simplywallst.com.
About TWSE:4720
Tex Year Industries
Manufactures and trades in viscose, adhesives, and hot-melt adhesives in Taiwan, Asia, Europe, the United States, and internationally.
Excellent balance sheet second-rate dividend payer.
Market Insights

Advertisement
Community Narratives
MINISO's fair value is projected at 26.69 with an anticipated PE ratio shift of 20x
Fair Value US$24.03|11.0% undervalued
BE
Community Contributor
Procter & Gamble: A Dividend Giant Facing Slowing Growth
Fair Value US$119.81|23.3% overvalued
AN
Community Contributor
Eli Lilly's Future Growth Driven by Tirzepatide and Favorable Market Conditions
Fair Value US$1.19k|13.8% undervalued
EA
Community Contributor