
Advertisement

To find a multi-bagger stock, what are the underlying trends we should look for in a business? Amongst other things, we'll want to see two things; firstly, a growing return on capital employed (ROCE) and secondly, an expansion in the company's amount of capital employed. This shows us that it's a compounding machine, able to continually reinvest its earnings back into the business and generate higher returns. Speaking of which, we noticed some great changes in Mayer Steel Pipe's (TPE:2020) returns on capital, so let's have a look.
What is Return On Capital Employed (ROCE)?
For those that aren't sure what ROCE is, it measures the amount of pre-tax profits a company can generate from the capital employed in its business. Analysts use this formula to calculate it for Mayer Steel Pipe:
Return on Capital Employed = Earnings Before Interest and Tax (EBIT) ÷ (Total Assets - Current Liabilities)
0.046 = NT$185m ÷ (NT$6.8b - NT$2.8b) (Based on the trailing twelve months to September 2020).
So, Mayer Steel Pipe has an ROCE of 4.6%. On its own that's a low return, but compared to the average of 3.6% generated by the Metals and Mining industry, it's much better.
See our latest analysis for Mayer Steel Pipe
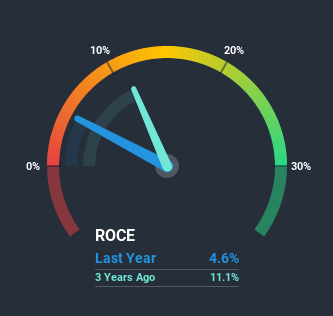
Historical performance is a great place to start when researching a stock so above you can see the gauge for Mayer Steel Pipe's ROCE against it's prior returns. If you want to delve into the historical earnings, revenue and cash flow of Mayer Steel Pipe, check out these free graphs here.
What Does the ROCE Trend For Mayer Steel Pipe Tell Us?
Mayer Steel Pipe has broken into the black (profitability) and we're sure it's a sight for sore eyes. The company was generating losses five years ago, but has managed to turn it around and as we saw earlier is now earning 4.6%, which is always encouraging. While returns have increased, the amount of capital employed by Mayer Steel Pipe has remained flat over the period. That being said, while an increase in efficiency is no doubt appealing, it'd be helpful to know if the company does have any investment plans going forward. Because in the end, a business can only get so efficient.
Another thing to note, Mayer Steel Pipe has a high ratio of current liabilities to total assets of 42%. This effectively means that suppliers (or short-term creditors) are funding a large portion of the business, so just be aware that this can introduce some elements of risk. While it's not necessarily a bad thing, it can be beneficial if this ratio is lower.
The Bottom Line On Mayer Steel Pipe's ROCE
In summary, we're delighted to see that Mayer Steel Pipe has been able to increase efficiencies and earn higher rates of return on the same amount of capital. And with the stock having performed exceptionally well over the last five years, these patterns are being accounted for by investors. With that being said, we still think the promising fundamentals mean the company deserves some further due diligence.
On a final note, we found 3 warning signs for Mayer Steel Pipe (1 is potentially serious) you should be aware of.
If you want to search for solid companies with great earnings, check out this free list of companies with good balance sheets and impressive returns on equity.
If you decide to trade Mayer Steel Pipe, use the lowest-cost* platform that is rated #1 Overall by Barron’s, Interactive Brokers. Trade stocks, options, futures, forex, bonds and funds on 135 markets, all from a single integrated account. Promoted
New: Manage All Your Stock Portfolios in One Place
We've created the ultimate portfolio companion for stock investors, and it's free.
• Connect an unlimited number of Portfolios and see your total in one currency
• Be alerted to new Warning Signs or Risks via email or mobile
• Track the Fair Value of your stocks
This article by Simply Wall St is general in nature. It does not constitute a recommendation to buy or sell any stock, and does not take account of your objectives, or your financial situation. We aim to bring you long-term focused analysis driven by fundamental data. Note that our analysis may not factor in the latest price-sensitive company announcements or qualitative material. Simply Wall St has no position in any stocks mentioned.
*Interactive Brokers Rated Lowest Cost Broker by StockBrokers.com Annual Online Review 2020
Have feedback on this article? Concerned about the content? Get in touch with us directly. Alternatively, email editorial-team (at) simplywallst.com.
About TWSE:2020
Mayer Steel Pipe
Processes and sells steel pipes, plates, and other metal products in Taiwan.
Excellent balance sheet second-rate dividend payer.
Market Insights


Advertisement
Community Narratives
Alphabet: The Under-appreciated Compounder Hiding in Plain Sight
Fair Value US$282.83|30.2% undervalued
BL
Community Contributor
Planet Labs: At The Heart Of The Emerging New Space Boom
Fair Value US$11.31|44.5% undervalued
AN
Community Contributor
Exxon in Guyana 5 year forecast Low $135 to High $189
Fair Value US$189.00|40.8% undervalued
AG
Community Contributor