
Advertisement
- Taiwan
- /
- Consumer Durables
- /
- TWSE:6807
FY Group (TWSE:6807) Will Be Hoping To Turn Its Returns On Capital Around
If you're looking for a multi-bagger, there's a few things to keep an eye out for. Firstly, we'd want to identify a growing return on capital employed (ROCE) and then alongside that, an ever-increasing base of capital employed. Basically this means that a company has profitable initiatives that it can continue to reinvest in, which is a trait of a compounding machine. Although, when we looked at FY Group (TWSE:6807), it didn't seem to tick all of these boxes.
Understanding Return On Capital Employed (ROCE)
If you haven't worked with ROCE before, it measures the 'return' (pre-tax profit) a company generates from capital employed in its business. The formula for this calculation on FY Group is:
Return on Capital Employed = Earnings Before Interest and Tax (EBIT) ÷ (Total Assets - Current Liabilities)
0.11 = NT$227m ÷ (NT$3.2b - NT$1.1b) (Based on the trailing twelve months to December 2023).
Thus, FY Group has an ROCE of 11%. On its own, that's a standard return, however it's much better than the 8.4% generated by the Consumer Durables industry.
See our latest analysis for FY Group
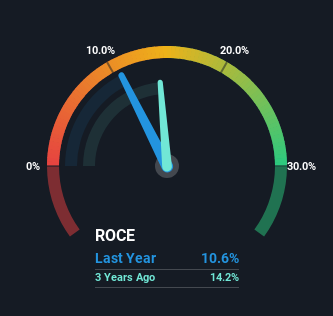
Historical performance is a great place to start when researching a stock so above you can see the gauge for FY Group's ROCE against it's prior returns. If you want to delve into the historical earnings , check out these free graphs detailing revenue and cash flow performance of FY Group.
The Trend Of ROCE
In terms of FY Group's historical ROCE movements, the trend isn't fantastic. Over the last four years, returns on capital have decreased to 11% from 36% four years ago. Given the business is employing more capital while revenue has slipped, this is a bit concerning. This could mean that the business is losing its competitive advantage or market share, because while more money is being put into ventures, it's actually producing a lower return - "less bang for their buck" per se.
On a related note, FY Group has decreased its current liabilities to 34% of total assets. So we could link some of this to the decrease in ROCE. What's more, this can reduce some aspects of risk to the business because now the company's suppliers or short-term creditors are funding less of its operations. Some would claim this reduces the business' efficiency at generating ROCE since it is now funding more of the operations with its own money.
Our Take On FY Group's ROCE
From the above analysis, we find it rather worrisome that returns on capital and sales for FY Group have fallen, meanwhile the business is employing more capital than it was four years ago. Yet despite these poor fundamentals, the stock has gained a huge 111% over the last year, so investors appear very optimistic. Regardless, we don't feel too comfortable with the fundamentals so we'd be steering clear of this stock for now.
One final note, you should learn about the 3 warning signs we've spotted with FY Group (including 1 which shouldn't be ignored) .
For those who like to invest in solid companies, check out this free list of companies with solid balance sheets and high returns on equity.
New: AI Stock Screener & Alerts
Our new AI Stock Screener scans the market every day to uncover opportunities.
• Dividend Powerhouses (3%+ Yield)
• Undervalued Small Caps with Insider Buying
• High growth Tech and AI Companies
Or build your own from over 50 metrics.
Have feedback on this article? Concerned about the content? Get in touch with us directly. Alternatively, email editorial-team (at) simplywallst.com.
This article by Simply Wall St is general in nature. We provide commentary based on historical data and analyst forecasts only using an unbiased methodology and our articles are not intended to be financial advice. It does not constitute a recommendation to buy or sell any stock, and does not take account of your objectives, or your financial situation. We aim to bring you long-term focused analysis driven by fundamental data. Note that our analysis may not factor in the latest price-sensitive company announcements or qualitative material. Simply Wall St has no position in any stocks mentioned.
About TWSE:6807
FY Group
Engages in the research, development, manufacture, and sale of indoor furniture in Taiwan, Europe, the United States, and Japan.
Excellent balance sheet second-rate dividend payer.
Similar Companies
Market Insights

Advertisement
Community Narratives
MicroVision will explode future revenue by 380.37% with a vision towards success
Fair Value US$60.00|98.4% undervalued
TH
Community Contributor
The Indispensable Artery for a New North American Economy
Fair Value CA$132.87|1.3% undervalued
TI
Community Contributor