- Taiwan
- /
- Consumer Durables
- /
- TWSE:3040
Can Global View Co., Ltd.'s (TWSE:3040) Weak Financials Pull The Plug On The Stock's Current Momentum On Its Share Price?


Global View (TWSE:3040) has had a great run on the share market with its stock up by a significant 15% over the last month. However, in this article, we decided to focus on its weak fundamentals, as long-term financial performance of a business is what ultimately dictates market outcomes. Particularly, we will be paying attention to Global View's ROE today.
Return on equity or ROE is a key measure used to assess how efficiently a company's management is utilizing the company's capital. In short, ROE shows the profit each dollar generates with respect to its shareholder investments.
Check out our latest analysis for Global View
How Is ROE Calculated?
The formula for return on equity is:
Return on Equity = Net Profit (from continuing operations) ÷ Shareholders' Equity
So, based on the above formula, the ROE for Global View is:
4.5% = NT$67m ÷ NT$1.5b (Based on the trailing twelve months to March 2024).
The 'return' is the yearly profit. That means that for every NT$1 worth of shareholders' equity, the company generated NT$0.04 in profit.
What Has ROE Got To Do With Earnings Growth?
Thus far, we have learned that ROE measures how efficiently a company is generating its profits. We now need to evaluate how much profit the company reinvests or "retains" for future growth which then gives us an idea about the growth potential of the company. Assuming everything else remains unchanged, the higher the ROE and profit retention, the higher the growth rate of a company compared to companies that don't necessarily bear these characteristics.
Global View's Earnings Growth And 4.5% ROE
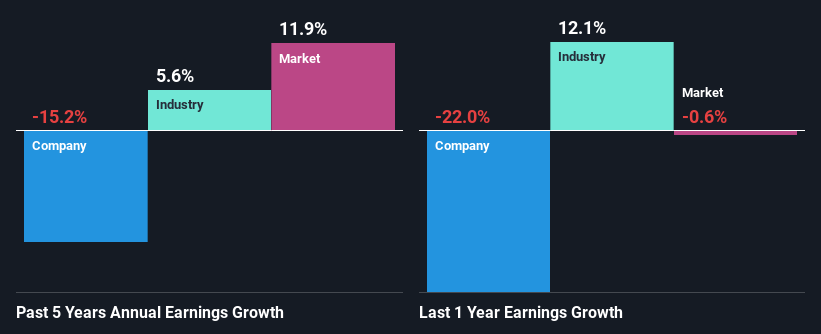
When you first look at it, Global View's ROE doesn't look that attractive. A quick further study shows that the company's ROE doesn't compare favorably to the industry average of 11% either. For this reason, Global View's five year net income decline of 15% is not surprising given its lower ROE. We reckon that there could also be other factors at play here. For instance, the company has a very high payout ratio, or is faced with competitive pressures.
So, as a next step, we compared Global View's performance against the industry and were disappointed to discover that while the company has been shrinking its earnings, the industry has been growing its earnings at a rate of 5.6% over the last few years.
Earnings growth is an important metric to consider when valuing a stock. It’s important for an investor to know whether the market has priced in the company's expected earnings growth (or decline). By doing so, they will have an idea if the stock is headed into clear blue waters or if swampy waters await. One good indicator of expected earnings growth is the P/E ratio which determines the price the market is willing to pay for a stock based on its earnings prospects. So, you may want to check if Global View is trading on a high P/E or a low P/E, relative to its industry.
Is Global View Efficiently Re-investing Its Profits?
With a three-year median payout ratio as high as 125%,Global View's shrinking earnings don't come as a surprise as the company is paying a dividend which is beyond its means. Its usually very hard to sustain dividend payments that are higher than reported profits. You can see the 4 risks we have identified for Global View by visiting our risks dashboard for free on our platform here.
Moreover, Global View has been paying dividends for at least ten years or more suggesting that management must have perceived that the shareholders prefer dividends over earnings growth.
Conclusion
In total, we would have a hard think before deciding on any investment action concerning Global View. Specifically, it has shown quite an unsatisfactory performance as far as earnings growth is concerned, and a poor ROE and an equally poor rate of reinvestment seem to be the reason behind this inadequate performance. Up till now, we've only made a short study of the company's growth data. You can do your own research on Global View and see how it has performed in the past by looking at this FREE detailed graph of past earnings, revenue and cash flows.
New: Manage All Your Stock Portfolios in One Place
We've created the ultimate portfolio companion for stock investors, and it's free.
• Connect an unlimited number of Portfolios and see your total in one currency
• Be alerted to new Warning Signs or Risks via email or mobile
• Track the Fair Value of your stocks
Have feedback on this article? Concerned about the content? Get in touch with us directly. Alternatively, email editorial-team (at) simplywallst.com.
This article by Simply Wall St is general in nature. We provide commentary based on historical data and analyst forecasts only using an unbiased methodology and our articles are not intended to be financial advice. It does not constitute a recommendation to buy or sell any stock, and does not take account of your objectives, or your financial situation. We aim to bring you long-term focused analysis driven by fundamental data. Note that our analysis may not factor in the latest price-sensitive company announcements or qualitative material. Simply Wall St has no position in any stocks mentioned.
About TWSE:3040
Global View
Manufactures and sells electronic dictionaries in Taiwan and Mainland China.
Flawless balance sheet slight.

