
Advertisement
- Taiwan
- /
- Consumer Durables
- /
- TWSE:6671
Update: San Neng Group Holdings (TPE:6671) Stock Gained 11% In The Last Year
We believe investing is smart because history shows that stock markets go higher in the long term. But if you choose that path, you're going to buy some stocks that fall short of the market. Unfortunately for shareholders, while the San Neng Group Holdings Co., Ltd. (TPE:6671) share price is up 11% in the last year, that falls short of the market return. We'll need to follow San Neng Group Holdings for a while to get a better sense of its share price trend, since it hasn't been listed for particularly long.
Check out our latest analysis for San Neng Group Holdings
While markets are a powerful pricing mechanism, share prices reflect investor sentiment, not just underlying business performance. One way to examine how market sentiment has changed over time is to look at the interaction between a company's share price and its earnings per share (EPS).
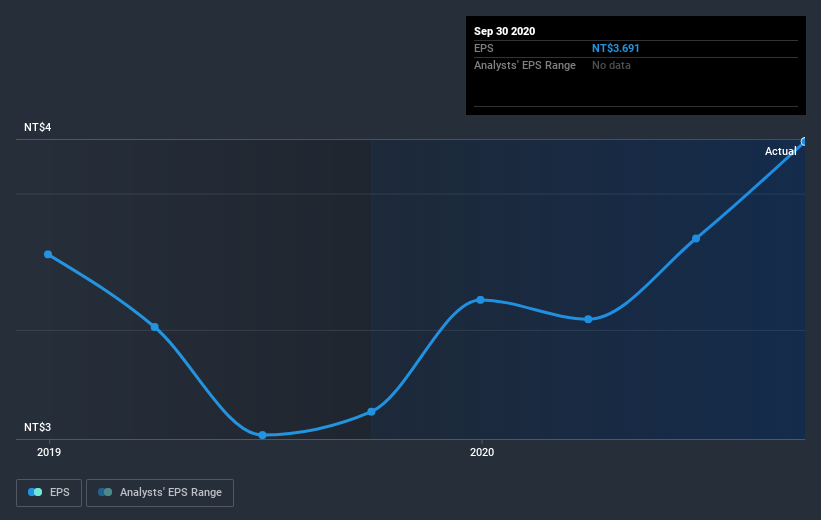
During the last year San Neng Group Holdings grew its earnings per share (EPS) by 36%. This EPS growth is significantly higher than the 11% increase in the share price. Therefore, it seems the market isn't as excited about San Neng Group Holdings as it was before. This could be an opportunity. This cautious sentiment is reflected in its (fairly low) P/E ratio of 10.80.
The image below shows how EPS has tracked over time (if you click on the image you can see greater detail).
Before buying or selling a stock, we always recommend a close examination of historic growth trends, available here.
What About Dividends?
When looking at investment returns, it is important to consider the difference between total shareholder return (TSR) and share price return. Whereas the share price return only reflects the change in the share price, the TSR includes the value of dividends (assuming they were reinvested) and the benefit of any discounted capital raising or spin-off. So for companies that pay a generous dividend, the TSR is often a lot higher than the share price return. As it happens, San Neng Group Holdings' TSR for the last year was 20%, which exceeds the share price return mentioned earlier. The dividends paid by the company have thusly boosted the total shareholder return.
A Different Perspective
We're happy to report that San Neng Group Holdings are up 20% over the year (even including dividends). While it's always nice to make a profit on the stock market, we do note that the TSR was no better than the broader market return of about 39%. That's a lot better than the more recent three month gain of 3.4%, implying that share price has plateaued recently, for now. It seems likely the market is waiting on fundamental developments with the business before pushing the share price higher (or lower). It's always interesting to track share price performance over the longer term. But to understand San Neng Group Holdings better, we need to consider many other factors. Like risks, for instance. Every company has them, and we've spotted 3 warning signs for San Neng Group Holdings (of which 1 is a bit concerning!) you should know about.
If you like to buy stocks alongside management, then you might just love this free list of companies. (Hint: insiders have been buying them).
Please note, the market returns quoted in this article reflect the market weighted average returns of stocks that currently trade on TW exchanges.
If you’re looking to trade San Neng Group Holdings, open an account with the lowest-cost* platform trusted by professionals, Interactive Brokers. Their clients from over 200 countries and territories trade stocks, options, futures, forex, bonds and funds worldwide from a single integrated account. Promoted
New: Manage All Your Stock Portfolios in One Place
We've created the ultimate portfolio companion for stock investors, and it's free.
• Connect an unlimited number of Portfolios and see your total in one currency
• Be alerted to new Warning Signs or Risks via email or mobile
• Track the Fair Value of your stocks
This article by Simply Wall St is general in nature. It does not constitute a recommendation to buy or sell any stock, and does not take account of your objectives, or your financial situation. We aim to bring you long-term focused analysis driven by fundamental data. Note that our analysis may not factor in the latest price-sensitive company announcements or qualitative material. Simply Wall St has no position in any stocks mentioned.
*Interactive Brokers Rated Lowest Cost Broker by StockBrokers.com Annual Online Review 2020
Have feedback on this article? Concerned about the content? Get in touch with us directly. Alternatively, email editorial-team (at) simplywallst.com.
About TWSE:6671
San Neng Group Holdings
Through its subsidiaries, engages in the manufacture, processing, and sale of baking equipment and peripheral products in Taiwan, Mainland China, Japan, and internationally.
Flawless balance sheet and fair value.
Market Insights

Advertisement
Weekly Picks
TH


TheWallstreetKing on MicroVision ·
MicroVision will explode future revenue by 380.37% with a vision towards success
Fair Value:US$6098.4% undervalued
109 followersusers have followed this narrative
10 commentsusers have commented on this narrative
21 likesusers have liked this narrative
TI


TibiT on Canadian National Railway ·
The Indispensable Artery for a New North American Economy
Fair Value:CA$132.870.7% overvalued
20 followersusers have followed this narrative
4 commentsusers have commented on this narrative
3 likesusers have liked this narrative
RE

RecMag on Agfa-Gevaert ·
Agfa-Gevaert is a digital and materials turnaround opportunity, with growth potential in ZIRFON, but carrying legacy risks.
Fair Value:€5.3988.2% undervalued
19 followersusers have followed this narrative
0 commentsusers have commented on this narrative
3 likesusers have liked this narrative
Recently Updated Narratives
NI

niteco on Texas Instruments ·
Engineered for Stability. Positioned for Growth.
Fair Value:US$314.4446.5% undervalued
1 followerusers have followed this narrative
0 commentsusers have commented on this narrative
0 likesusers have liked this narrative
BE


Bejgal on MINISO Group Holding ·
MINISO's fair value is projected at 26.69 with an anticipated PE ratio shift of 20x
Fair Value:US$28.1829.5% undervalued
46 followersusers have followed this narrative
3 commentsusers have commented on this narrative
0 likesusers have liked this narrative
BE

Bejgal on Fiverr International ·
Fiverr International will transform the freelance industry with AI-powered growth
Fair Value:US$36.8143.1% undervalued
79 followersusers have followed this narrative
7 commentsusers have commented on this narrative
1 likeusers have liked this narrative
Popular Narratives
TH
TheWallstreetKing on MicroVision ·
MicroVision will explode future revenue by 380.37% with a vision towards success
Fair Value:US$6098.4% undervalued
109 followersusers have followed this narrative
10 commentsusers have commented on this narrative
21 likesusers have liked this narrative
AN


AnalystConsensusTarget on NVIDIA ·
NVDA: Expanding AI Demand Will Drive Major Data Center Investments Through 2026
Fair Value:US$250.3929.3% undervalued
939 followersusers have followed this narrative
6 commentsusers have commented on this narrative
24 likesusers have liked this narrative
OS


oscargarcia on Alphabet ·
The company that turned a verb into a global necessity and basically runs the modern internet, digital ads, smartphones, maps, and AI.
Fair Value:US$3405.8% undervalued
145 followersusers have followed this narrative
6 commentsusers have commented on this narrative
18 likesusers have liked this narrative