
Advertisement
Why Tycoons Group EnterpriseLtd's (TWSE:2022) Earnings Are Better Than They Seem
Tycoons Group Enterprise Co.,Ltd.'s (TWSE:2022) solid earnings announcement recently didn't do much to the stock price. We did some analysis to find out why and believe that investors might be missing some encouraging factors contained in the earnings.
View our latest analysis for Tycoons Group EnterpriseLtd
A Closer Look At Tycoons Group EnterpriseLtd's Earnings
One key financial ratio used to measure how well a company converts its profit to free cash flow (FCF) is the accrual ratio. In plain english, this ratio subtracts FCF from net profit, and divides that number by the company's average operating assets over that period. The ratio shows us how much a company's profit exceeds its FCF.
Therefore, it's actually considered a good thing when a company has a negative accrual ratio, but a bad thing if its accrual ratio is positive. While having an accrual ratio above zero is of little concern, we do think it's worth noting when a company has a relatively high accrual ratio. Notably, there is some academic evidence that suggests that a high accrual ratio is a bad sign for near-term profits, generally speaking.
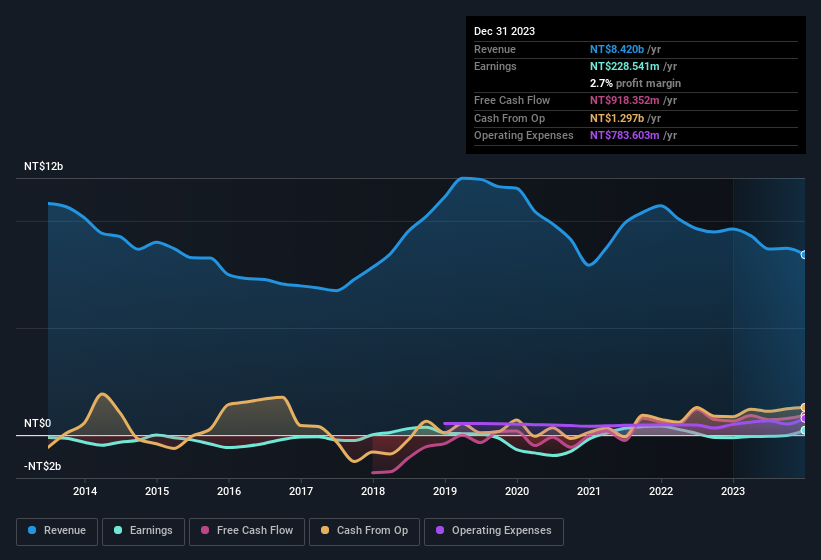
Tycoons Group EnterpriseLtd has an accrual ratio of -0.10 for the year to December 2023. That implies it has good cash conversion, and implies that its free cash flow solidly exceeded its profit last year. In fact, it had free cash flow of NT$918m in the last year, which was a lot more than its statutory profit of NT$228.5m. Tycoons Group EnterpriseLtd shareholders are no doubt pleased that free cash flow improved over the last twelve months.
Note: we always recommend investors check balance sheet strength. Click here to be taken to our balance sheet analysis of Tycoons Group EnterpriseLtd.
Our Take On Tycoons Group EnterpriseLtd's Profit Performance
Tycoons Group EnterpriseLtd's accrual ratio is solid, and indicates strong free cash flow, as we discussed, above. Because of this, we think Tycoons Group EnterpriseLtd's earnings potential is at least as good as it seems, and maybe even better! And one can definitely find a positive in the fact that it made a profit this year, despite losing money last year. At the end of the day, it's essential to consider more than just the factors above, if you want to understand the company properly. While it's very important to consider the profit and loss statement, you can also learn a lot about a company by looking at its balance sheet. If you're interested we have a graphic representation of Tycoons Group EnterpriseLtd's balance sheet.
This note has only looked at a single factor that sheds light on the nature of Tycoons Group EnterpriseLtd's profit. But there is always more to discover if you are capable of focussing your mind on minutiae. Some people consider a high return on equity to be a good sign of a quality business. While it might take a little research on your behalf, you may find this free collection of companies boasting high return on equity, or this list of stocks that insiders are buying to be useful.
Valuation is complex, but we're here to simplify it.
Discover if Tycoons Group EnterpriseLtd might be undervalued or overvalued with our detailed analysis, featuring fair value estimates, potential risks, dividends, insider trades, and its financial condition.
Access Free AnalysisHave feedback on this article? Concerned about the content? Get in touch with us directly. Alternatively, email editorial-team (at) simplywallst.com.
This article by Simply Wall St is general in nature. We provide commentary based on historical data and analyst forecasts only using an unbiased methodology and our articles are not intended to be financial advice. It does not constitute a recommendation to buy or sell any stock, and does not take account of your objectives, or your financial situation. We aim to bring you long-term focused analysis driven by fundamental data. Note that our analysis may not factor in the latest price-sensitive company announcements or qualitative material. Simply Wall St has no position in any stocks mentioned.
About TWSE:2022
Tycoons Group EnterpriseLtd
Produces, processes, sells, exports, and leases screws, screw nuts, washers, and steel threads in America, Thailand, rest of Asia, Europe, and internationally.
Flawless balance sheet second-rate dividend payer.
Similar Companies
Market Insights

Advertisement
Community Narratives
MicroVision will explode future revenue by 380.37% with a vision towards success
Fair Value US$60|98.4% undervalued
TH
Community Contributor
The Indispensable Artery for a New North American Economy
Fair Value CA$132.87|0.7% overvalued
TI
Community Contributor
Recently Updated Narratives
BE


Bejgal on MINISO Group Holding ·
MINISO's fair value is projected at 26.69 with an anticipated PE ratio shift of 20x
Fair Value:US$28.1829.5% undervalued
46 followersusers have followed this narrative
3 commentsusers have commented on this narrative
0 likesusers have liked this narrative
BE

Bejgal on Fiverr International ·
Fiverr International will transform the freelance industry with AI-powered growth
Fair Value:US$36.8143.1% undervalued
78 followersusers have followed this narrative
7 commentsusers have commented on this narrative
0 likesusers have liked this narrative
CE

cementafriend on Constellation Energy ·
Constellation Energy Dividends and Growth
Fair Value:US$348.054.7% overvalued
2 followersusers have followed this narrative
0 commentsusers have commented on this narrative
0 likesusers have liked this narrative
Popular Narratives
TH

TheWallstreetKing on MicroVision ·
MicroVision will explode future revenue by 380.37% with a vision towards success
Fair Value:US$6098.4% undervalued
108 followersusers have followed this narrative
10 commentsusers have commented on this narrative
21 likesusers have liked this narrative
AN


AnalystConsensusTarget on NVIDIA ·
NVDA: Expanding AI Demand Will Drive Major Data Center Investments Through 2026
Fair Value:US$250.3929.3% undervalued
937 followersusers have followed this narrative
6 commentsusers have commented on this narrative
24 likesusers have liked this narrative
OS


oscargarcia on Alphabet ·
The company that turned a verb into a global necessity and basically runs the modern internet, digital ads, smartphones, maps, and AI.
Fair Value:US$3405.8% undervalued
144 followersusers have followed this narrative
6 commentsusers have commented on this narrative
18 likesusers have liked this narrative