
Advertisement
- Taiwan
- /
- Electrical
- /
- TPEX:8109
P-Duke Technology Co.,Ltd.'s (GTSM:8109) Has Had A Decent Run On The Stock market: Are Fundamentals In The Driver's Seat?
P-Duke TechnologyLtd's (GTSM:8109) stock up by 3.8% over the past three months. As most would know, long-term fundamentals have a strong correlation with market price movements, so we decided to look at the company's key financial indicators today to determine if they have any role to play in the recent price movement. Specifically, we decided to study P-Duke TechnologyLtd's ROE in this article.
Return on equity or ROE is a key measure used to assess how efficiently a company's management is utilizing the company's capital. In short, ROE shows the profit each dollar generates with respect to its shareholder investments.
Check out our latest analysis for P-Duke TechnologyLtd
How Is ROE Calculated?
Return on equity can be calculated by using the formula:
Return on Equity = Net Profit (from continuing operations) ÷ Shareholders' Equity
So, based on the above formula, the ROE for P-Duke TechnologyLtd is:
18% = NT$258m ÷ NT$1.4b (Based on the trailing twelve months to September 2020).
The 'return' is the yearly profit. One way to conceptualize this is that for each NT$1 of shareholders' capital it has, the company made NT$0.18 in profit.
What Has ROE Got To Do With Earnings Growth?
We have already established that ROE serves as an efficient profit-generating gauge for a company's future earnings. Depending on how much of these profits the company reinvests or "retains", and how effectively it does so, we are then able to assess a company’s earnings growth potential. Generally speaking, other things being equal, firms with a high return on equity and profit retention, have a higher growth rate than firms that don’t share these attributes.
A Side By Side comparison of P-Duke TechnologyLtd's Earnings Growth And 18% ROE
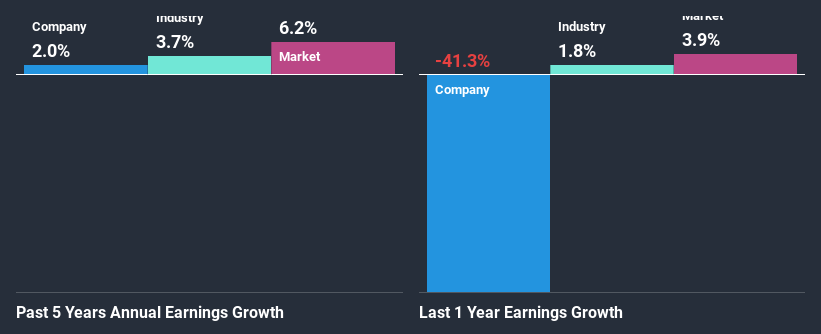
To begin with, P-Duke TechnologyLtd seems to have a respectable ROE. On comparing with the average industry ROE of 7.9% the company's ROE looks pretty remarkable. However, we are curious as to how the high returns still resulted in flat growth for P-Duke TechnologyLtd in the past five years. Based on this, we feel that there might be other reasons which haven't been discussed so far in this article that could be hampering the company's growth. These include low earnings retention or poor allocation of capital.
Next, on comparing with the industry net income growth, we found that P-Duke TechnologyLtd's reported growth was lower than the industry growth of 3.7% in the same period, which is not something we like to see.
The basis for attaching value to a company is, to a great extent, tied to its earnings growth. What investors need to determine next is if the expected earnings growth, or the lack of it, is already built into the share price. Doing so will help them establish if the stock's future looks promising or ominous. Is P-Duke TechnologyLtd fairly valued compared to other companies? These 3 valuation measures might help you decide.
Is P-Duke TechnologyLtd Making Efficient Use Of Its Profits?
P-Duke TechnologyLtd has a high three-year median payout ratio of 67% (or a retention ratio of 33%), meaning that the company is paying most of its profits as dividends to its shareholders. This does go some way in explaining why there's been no growth in its earnings.
In addition, P-Duke TechnologyLtd has been paying dividends over a period of at least ten years suggesting that keeping up dividend payments is way more important to the management even if it comes at the cost of business growth.
Summary
In total, it does look like P-Duke TechnologyLtd has some positive aspects to its business. However, while the company does have a high ROE, its earnings growth number is quite disappointing. This can be blamed on the fact that it reinvests only a small portion of its profits and pays out the rest as dividends. So far, we've only made a quick discussion around the company's earnings growth. So it may be worth checking this free detailed graph of P-Duke TechnologyLtd's past earnings, as well as revenue and cash flows to get a deeper insight into the company's performance.
If you’re looking to trade P-Duke TechnologyLtd, open an account with the lowest-cost* platform trusted by professionals, Interactive Brokers. Their clients from over 200 countries and territories trade stocks, options, futures, forex, bonds and funds worldwide from a single integrated account. Promoted
New: Manage All Your Stock Portfolios in One Place
We've created the ultimate portfolio companion for stock investors, and it's free.
• Connect an unlimited number of Portfolios and see your total in one currency
• Be alerted to new Warning Signs or Risks via email or mobile
• Track the Fair Value of your stocks
This article by Simply Wall St is general in nature. It does not constitute a recommendation to buy or sell any stock, and does not take account of your objectives, or your financial situation. We aim to bring you long-term focused analysis driven by fundamental data. Note that our analysis may not factor in the latest price-sensitive company announcements or qualitative material. Simply Wall St has no position in any stocks mentioned.
*Interactive Brokers Rated Lowest Cost Broker by StockBrokers.com Annual Online Review 2020
Have feedback on this article? Concerned about the content? Get in touch with us directly. Alternatively, email editorial-team (at) simplywallst.com.
About TPEX:8109
P-Duke TechnologyLtd
Engages in the research, development, manufacture, and trading of power conversion products in Taiwan, Europe, the United States, the Asia Pacific, and internationally.
Flawless balance sheet second-rate dividend payer.
Market Insights

Advertisement
Community Narratives
MINISO's fair value is projected at 26.69 with an anticipated PE ratio shift of 20x
Fair Value US$24.03|11.0% undervalued
BE
Community Contributor
Procter & Gamble: A Dividend Giant Facing Slowing Growth
Fair Value US$119.81|23.3% overvalued
AN
Community Contributor
Eli Lilly's Future Growth Driven by Tirzepatide and Favorable Market Conditions
Fair Value US$1.19k|13.8% undervalued
EA
Community Contributor