- Taiwan
- /
- Electrical
- /
- TPEX:6124
Do Fundamentals Have Any Role To Play In Driving Yeh-Chiang Technology Corp.'s (GTSM:6124) Stock Up Recently?

Most readers would already know that Yeh-Chiang Technology's (GTSM:6124) stock increased by 1.9% over the past week. We wonder if and what role the company's financials play in that price change as a company's long-term fundamentals usually dictate market outcomes. Particularly, we will be paying attention to Yeh-Chiang Technology's ROE today.
Return on Equity or ROE is a test of how effectively a company is growing its value and managing investors’ money. In simpler terms, it measures the profitability of a company in relation to shareholder's equity.
Check out our latest analysis for Yeh-Chiang Technology
How Is ROE Calculated?
Return on equity can be calculated by using the formula:
Return on Equity = Net Profit (from continuing operations) ÷ Shareholders' Equity
So, based on the above formula, the ROE for Yeh-Chiang Technology is:
8.5% = NT$269m ÷ NT$3.2b (Based on the trailing twelve months to September 2020).
The 'return' is the yearly profit. Another way to think of that is that for every NT$1 worth of equity, the company was able to earn NT$0.08 in profit.
Why Is ROE Important For Earnings Growth?
We have already established that ROE serves as an efficient profit-generating gauge for a company's future earnings. Based on how much of its profits the company chooses to reinvest or "retain", we are then able to evaluate a company's future ability to generate profits. Generally speaking, other things being equal, firms with a high return on equity and profit retention, have a higher growth rate than firms that don’t share these attributes.
Yeh-Chiang Technology's Earnings Growth And 8.5% ROE
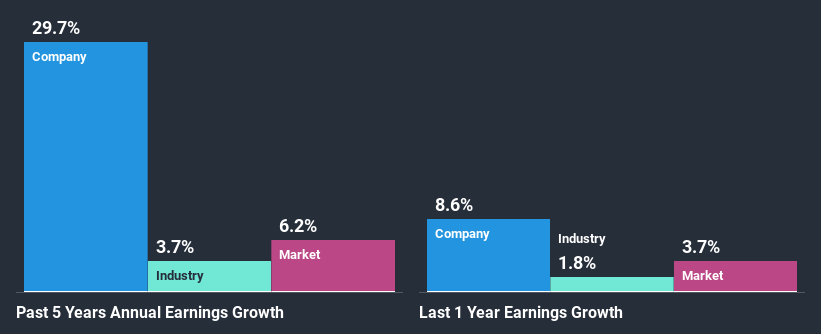
On the face of it, Yeh-Chiang Technology's ROE is not much to talk about. However, given that the company's ROE is similar to the average industry ROE of 7.9%, we may spare it some thought. Looking at Yeh-Chiang Technology's exceptional 30% five-year net income growth in particular, we are definitely impressed. Considering the moderately low ROE, it is quite possible that there might be some other aspects that are positively influencing the company's earnings growth. Such as - high earnings retention or an efficient management in place.
We then compared Yeh-Chiang Technology's net income growth with the industry and we're pleased to see that the company's growth figure is higher when compared with the industry which has a growth rate of 3.7% in the same period.
The basis for attaching value to a company is, to a great extent, tied to its earnings growth. It’s important for an investor to know whether the market has priced in the company's expected earnings growth (or decline). This then helps them determine if the stock is placed for a bright or bleak future. Is Yeh-Chiang Technology fairly valued compared to other companies? These 3 valuation measures might help you decide.
Is Yeh-Chiang Technology Making Efficient Use Of Its Profits?
Conclusion
In total, it does look like Yeh-Chiang Technology has some positive aspects to its business. Despite its low rate of return, the fact that the company reinvests a very high portion of its profits into its business, no doubt contributed to its high earnings growth. While we won't completely dismiss the company, what we would do, is try to ascertain how risky the business is to make a more informed decision around the company. You can see the 1 risk we have identified for Yeh-Chiang Technology by visiting our risks dashboard for free on our platform here.
If you decide to trade Yeh-Chiang Technology, use the lowest-cost* platform that is rated #1 Overall by Barron’s, Interactive Brokers. Trade stocks, options, futures, forex, bonds and funds on 135 markets, all from a single integrated account. Promoted
The New Payments ETF Is Live on NASDAQ:
Money is moving to real-time rails, and a newly listed ETF now gives investors direct exposure. Fast settlement. Institutional custody. Simple access.
Explore how this launch could reshape portfolios
Sponsored ContentNew: Manage All Your Stock Portfolios in One Place
We've created the ultimate portfolio companion for stock investors, and it's free.
• Connect an unlimited number of Portfolios and see your total in one currency
• Be alerted to new Warning Signs or Risks via email or mobile
• Track the Fair Value of your stocks
This article by Simply Wall St is general in nature. It does not constitute a recommendation to buy or sell any stock, and does not take account of your objectives, or your financial situation. We aim to bring you long-term focused analysis driven by fundamental data. Note that our analysis may not factor in the latest price-sensitive company announcements or qualitative material. Simply Wall St has no position in any stocks mentioned.
*Interactive Brokers Rated Lowest Cost Broker by StockBrokers.com Annual Online Review 2020
Have feedback on this article? Concerned about the content? Get in touch with us directly. Alternatively, email editorial-team (at) simplywallst.com.
About TPEX:6124
Yeh Chiang Technology
Engages in the production and sale of heat pipe components in Taiwan and internationally.
Mediocre balance sheet with minimal risk.
Similar Companies
Market Insights

Weekly Picks

Early mover in a fast growing industry. Likely to experience share price volatility as they scale


A case for CA$31.80 (undiluted), aka 8,616% upside from CA$0.37 (an 86 bagger!).


Moderation and Stabilisation: HOLD: Fair Price based on a 4-year Cycle is $12.08
Recently Updated Narratives

Airbnb Stock: Platform Growth in a World of Saturation and Scrutiny

Adobe Stock: AI-Fueled ARR Growth Pushes Guidance Higher, But Cost Pressures Loom

Thomson Reuters Stock: When Legal Intelligence Becomes Mission-Critical Infrastructure
Popular Narratives


Crazy Undervalued 42 Baggers Silver Play (Active & Running Mine)


NVDA: Expanding AI Demand Will Drive Major Data Center Investments Through 2026

The AI Infrastructure Giant Grows Into Its Valuation
Trending Discussion


