
Advertisement
The simplest way to benefit from a rising market is to buy an index fund. When you buy individual stocks, you can make higher profits, but you also face the risk of under-performance. Unfortunately the Yeh-Chiang Technology Corp. (GTSM:6124) share price slid 38% over twelve months. That's disappointing when you consider the market returned 23%. The silver lining (for longer term investors) is that the stock is still 17% higher than it was three years ago.
See our latest analysis for Yeh-Chiang Technology
While the efficient markets hypothesis continues to be taught by some, it has been proven that markets are over-reactive dynamic systems, and investors are not always rational. One way to examine how market sentiment has changed over time is to look at the interaction between a company's share price and its earnings per share (EPS).
During the unfortunate twelve months during which the Yeh-Chiang Technology share price fell, it actually saw its earnings per share (EPS) improve by 8.6%. It could be that the share price was previously over-hyped.
The divergence between the EPS and the share price is quite notable, during the year. So it's well worth checking out some other metrics, too.
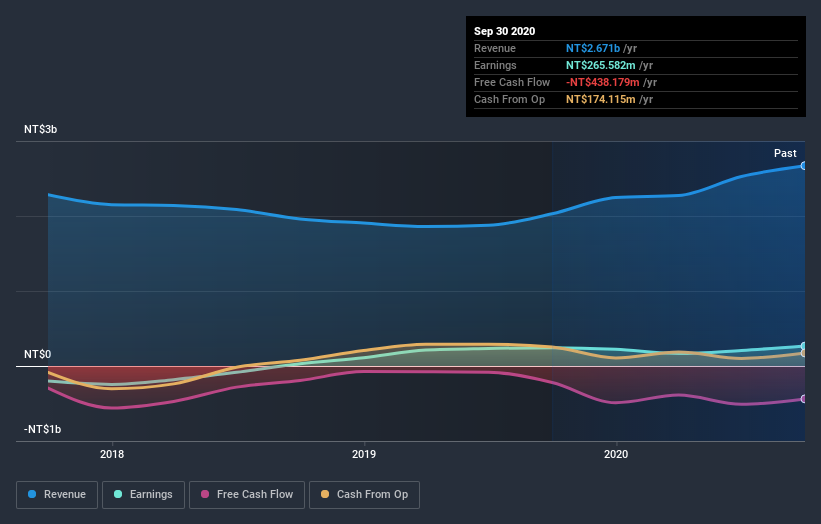
Yeh-Chiang Technology managed to grow revenue over the last year, which is usually a real positive. Since the fundamental metrics don't readily explain the share price drop, there might be an opportunity if the market has overreacted.
The company's revenue and earnings (over time) are depicted in the image below (click to see the exact numbers).
It's probably worth noting that the CEO is paid less than the median at similar sized companies. It's always worth keeping an eye on CEO pay, but a more important question is whether the company will grow earnings throughout the years. This free interactive report on Yeh-Chiang Technology's earnings, revenue and cash flow is a great place to start, if you want to investigate the stock further.
A Different Perspective
While the broader market gained around 23% in the last year, Yeh-Chiang Technology shareholders lost 38%. Even the share prices of good stocks drop sometimes, but we want to see improvements in the fundamental metrics of a business, before getting too interested. On the bright side, long term shareholders have made money, with a gain of 2% per year over half a decade. If the fundamental data continues to indicate long term sustainable growth, the current sell-off could be an opportunity worth considering. It's always interesting to track share price performance over the longer term. But to understand Yeh-Chiang Technology better, we need to consider many other factors. To that end, you should be aware of the 1 warning sign we've spotted with Yeh-Chiang Technology .
Of course, you might find a fantastic investment by looking elsewhere. So take a peek at this free list of companies we expect will grow earnings.
Please note, the market returns quoted in this article reflect the market weighted average returns of stocks that currently trade on TW exchanges.
If you decide to trade Yeh-Chiang Technology, use the lowest-cost* platform that is rated #1 Overall by Barron’s, Interactive Brokers. Trade stocks, options, futures, forex, bonds and funds on 135 markets, all from a single integrated account. Promoted
New: Manage All Your Stock Portfolios in One Place
We've created the ultimate portfolio companion for stock investors, and it's free.
• Connect an unlimited number of Portfolios and see your total in one currency
• Be alerted to new Warning Signs or Risks via email or mobile
• Track the Fair Value of your stocks
This article by Simply Wall St is general in nature. It does not constitute a recommendation to buy or sell any stock, and does not take account of your objectives, or your financial situation. We aim to bring you long-term focused analysis driven by fundamental data. Note that our analysis may not factor in the latest price-sensitive company announcements or qualitative material. Simply Wall St has no position in any stocks mentioned.
*Interactive Brokers Rated Lowest Cost Broker by StockBrokers.com Annual Online Review 2020
Have feedback on this article? Concerned about the content? Get in touch with us directly. Alternatively, email editorial-team (at) simplywallst.com.
About TPEX:6124
Yeh Chiang Technology
Engages in the production and sale of heat pipe components in Taiwan and internationally.
Mediocre balance sheet with minimal risk.
Similar Companies
Market Insights

Advertisement
Community Narratives
MINISO's fair value is projected at 26.69 with an anticipated PE ratio shift of 20x
Fair Value US$24.03|11.0% undervalued
BE
Community Contributor
Procter & Gamble: A Dividend Giant Facing Slowing Growth
Fair Value US$119.81|23.3% overvalued
AN
Community Contributor
Eli Lilly's Future Growth Driven by Tirzepatide and Favorable Market Conditions
Fair Value US$1.19k|13.8% undervalued
EA
Community Contributor