Advertisement
- Indonesia
- /
- Construction
- /
- IDX:JKON
Top Dividend Stocks To Consider For Your Portfolio

Simply Wall St
Reviewed by Simply Wall St

As global markets celebrate the Federal Reserve's announcement of upcoming interest rate cuts, major indices like the Dow Jones Industrial Average and S&P 500 have surged toward record highs. In this buoyant environment, dividend stocks become particularly attractive for investors seeking stable income and potential capital appreciation. A good dividend stock typically offers a reliable payout history, strong financial health, and growth potential—all crucial factors to consider in today’s dynamic market conditions.
Top 10 Dividend Stocks
| Name | Dividend Yield | Dividend Rating |
| Yamato Kogyo (TSE:5444) | 4.16% | ★★★★★★ |
| Allianz (XTRA:ALV) | 5.02% | ★★★★★★ |
| Guaranty Trust Holding (NGSE:GTCO) | 7.03% | ★★★★★★ |
| Premier Financial (NasdaqGS:PFC) | 4.92% | ★★★★★★ |
| Innotech (TSE:9880) | 4.64% | ★★★★★★ |
| CAC Holdings (TSE:4725) | 4.48% | ★★★★★★ |
| FALCO HOLDINGS (TSE:4671) | 6.42% | ★★★★★★ |
| KurimotoLtd (TSE:5602) | 4.74% | ★★★★★★ |
| James Latham (AIM:LTHM) | 5.75% | ★★★★★★ |
| Banque Cantonale Vaudoise (SWX:BCVN) | 4.70% | ★★★★★★ |
Click here to see the full list of 2074 stocks from our Top Dividend Stocks screener.
Let's uncover some gems from our specialized screener.
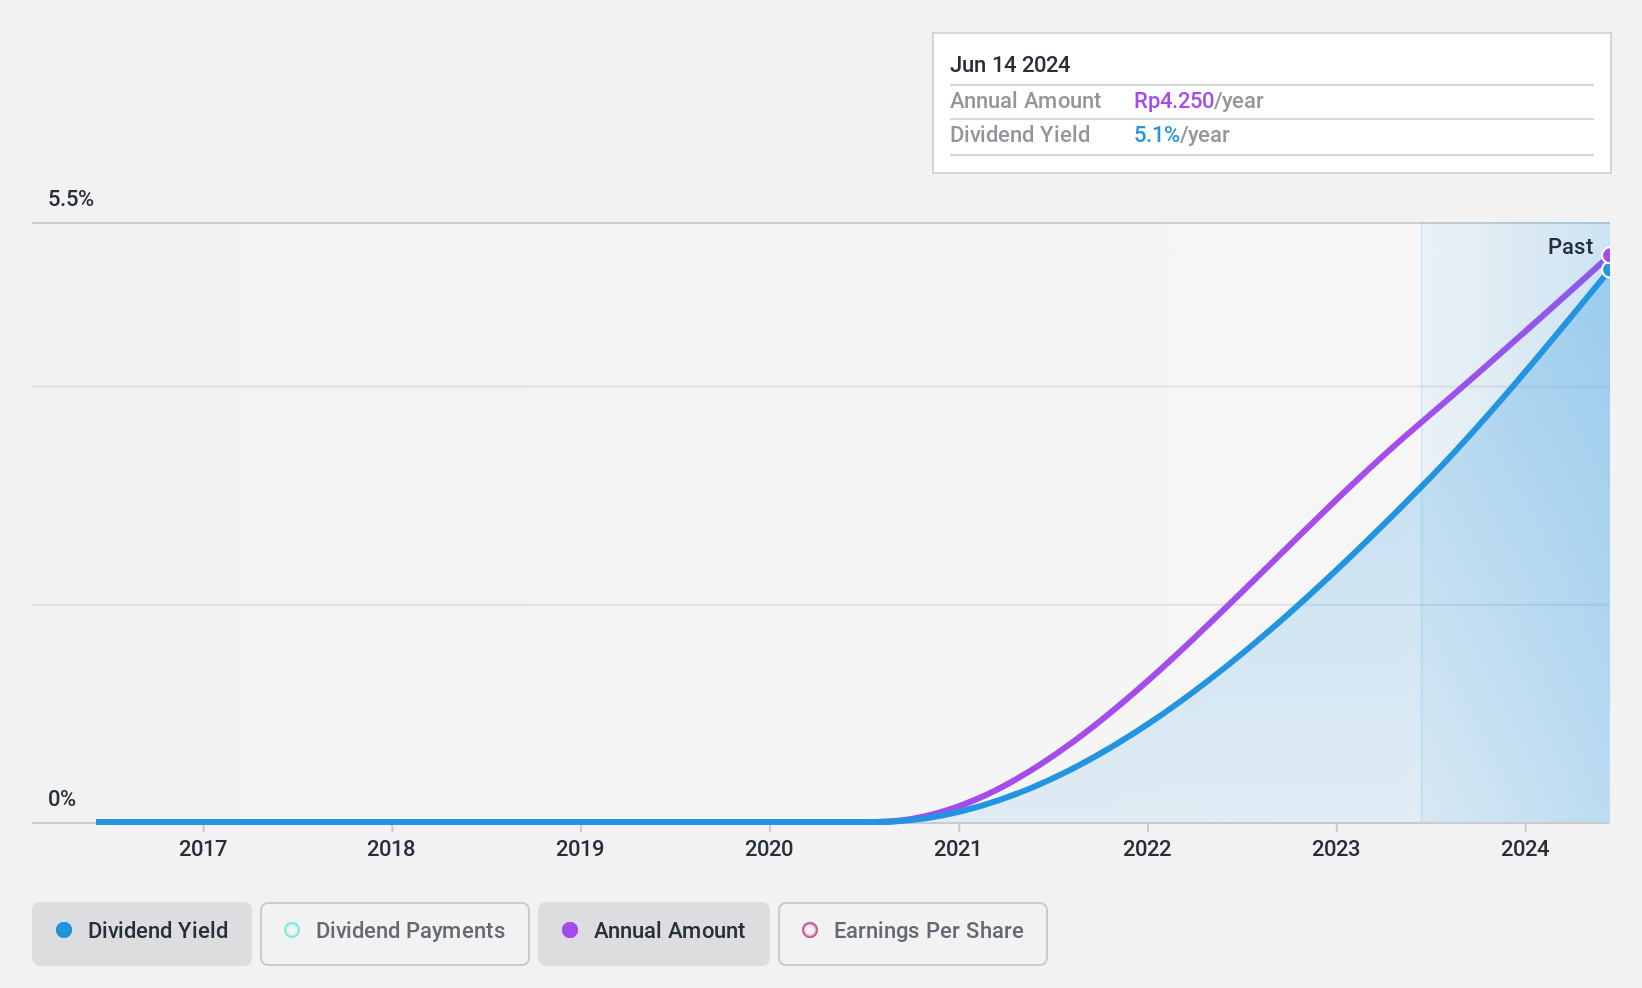
Jaya Konstruksi Manggala Pratama (IDX:JKON)
Simply Wall St Dividend Rating: ★★★★★☆
Overview: PT Jaya Konstruksi Manggala Pratama Tbk operates in the construction sector in Indonesia and has a market cap of approximately IDR1.79 billion.
Operations: PT Jaya Konstruksi Manggala Pratama Tbk generates revenue from various segments including Gas (IDR492.04 million), Asphalt (IDR1.87 billion), Construction (IDR1.06 billion), Handling Equipments (IDR20.52 million), Other Service Revenue (IDR190.51 million), and Manufacture - Concrete (IDR666.92 million).
Dividend Yield: 3.9%
Jaya Konstruksi Manggala Pratama's dividend payments are well-supported by earnings and cash flows, with a payout ratio of 29.5% and a cash payout ratio of 22%. Despite its dividend yield of 3.86% being lower than the top quartile in the Indonesian market, JKON has provided stable and growing dividends over the past decade. Recent earnings show a slight decrease in net income to IDR 24 billion for H1 2024, but dividends remain reliable.
- Click here and access our complete dividend analysis report to understand the dynamics of Jaya Konstruksi Manggala Pratama.
- Insights from our recent valuation report point to the potential overvaluation of Jaya Konstruksi Manggala Pratama shares in the market.
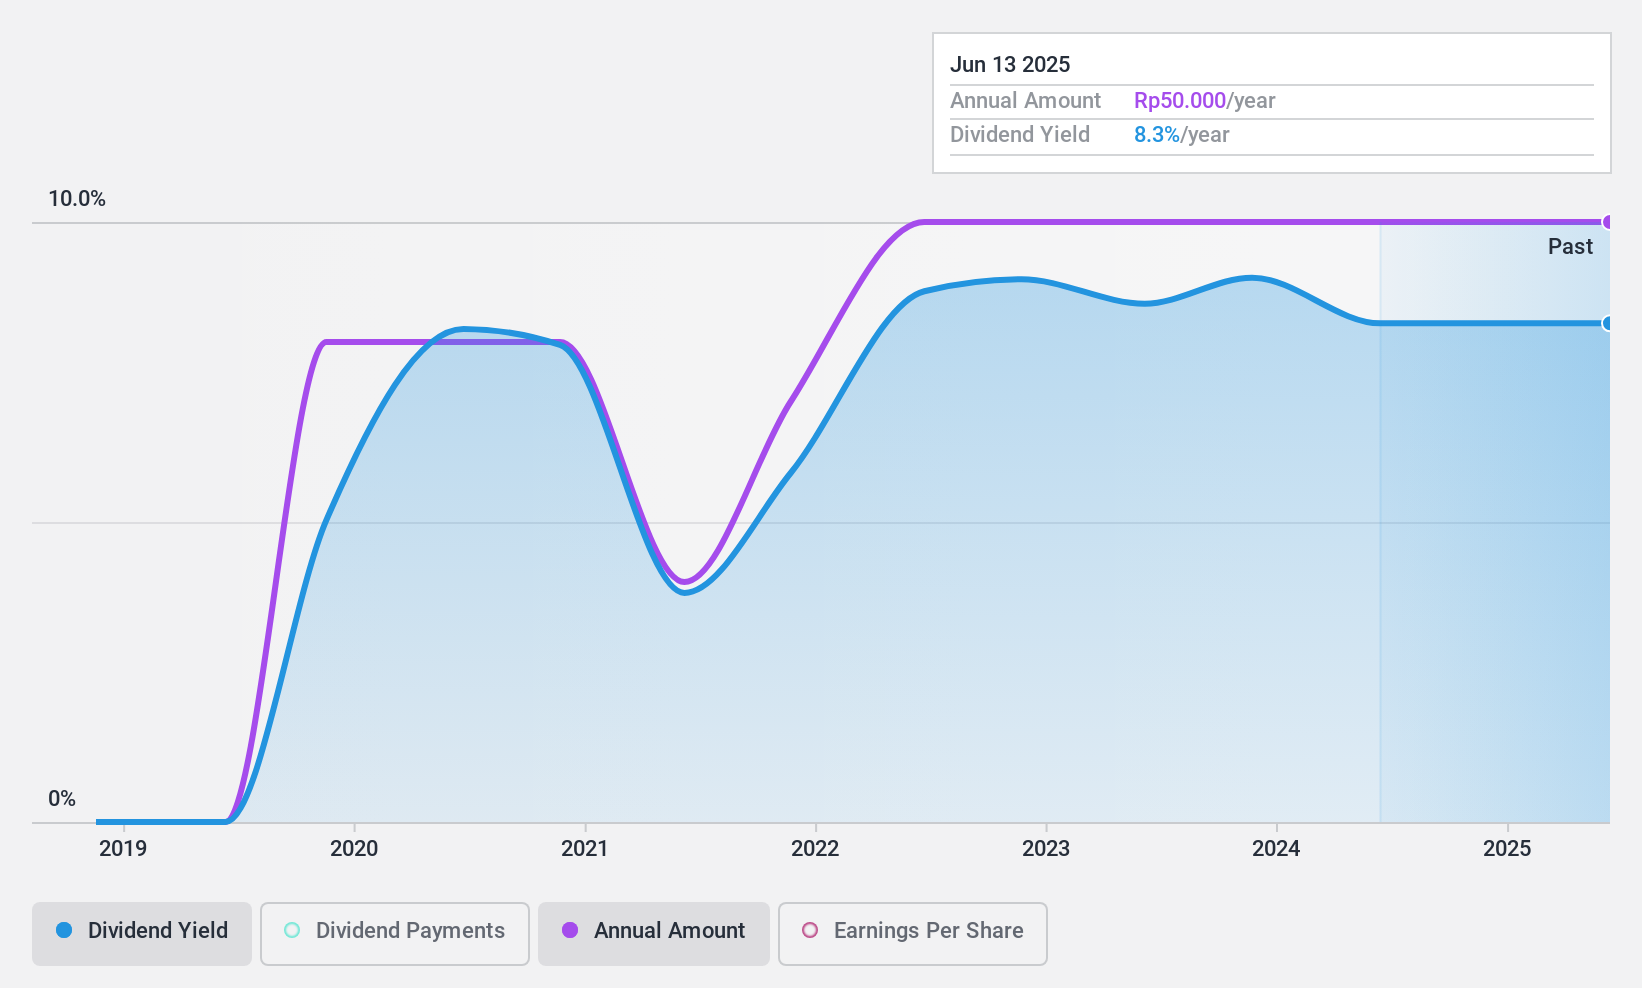
Surya Pertiwi (IDX:SPTO)
Simply Wall St Dividend Rating: ★★★★☆☆
Overview: PT Surya Pertiwi Tbk, with a market cap of IDR1.66 trillion, distributes bathroom and kitchen products in Indonesia.
Operations: PT Surya Pertiwi Tbk's revenue segments include Trading and Manufacturing - Sanitary (IDR1.55 billion), Trading and Manufacturing - Fitting (IDR1.30 billion), Rental Income (IDR79.39 million), Trading and Manufacturing - Others (IDR67.03 million), and Trading and Manufacturing - Kitchen (IDR27.96 million).
Dividend Yield: 8.1%
Surya Pertiwi's dividend payments are well-covered by earnings (24.5% payout ratio) and cash flows (52.4% cash payout ratio). The company has a high dividend yield of 8.13%, placing it in the top 25% of Indonesian dividend payers. However, its five-year dividend history is marked by volatility and unreliability, with significant annual drops exceeding 20%. Recent earnings show growth, with net income rising to IDR 115.20 million for H1 2024 from IDR 94.64 million a year ago.
- Delve into the full analysis dividend report here for a deeper understanding of Surya Pertiwi.
- Our comprehensive valuation report raises the possibility that Surya Pertiwi is priced lower than what may be justified by its financials.
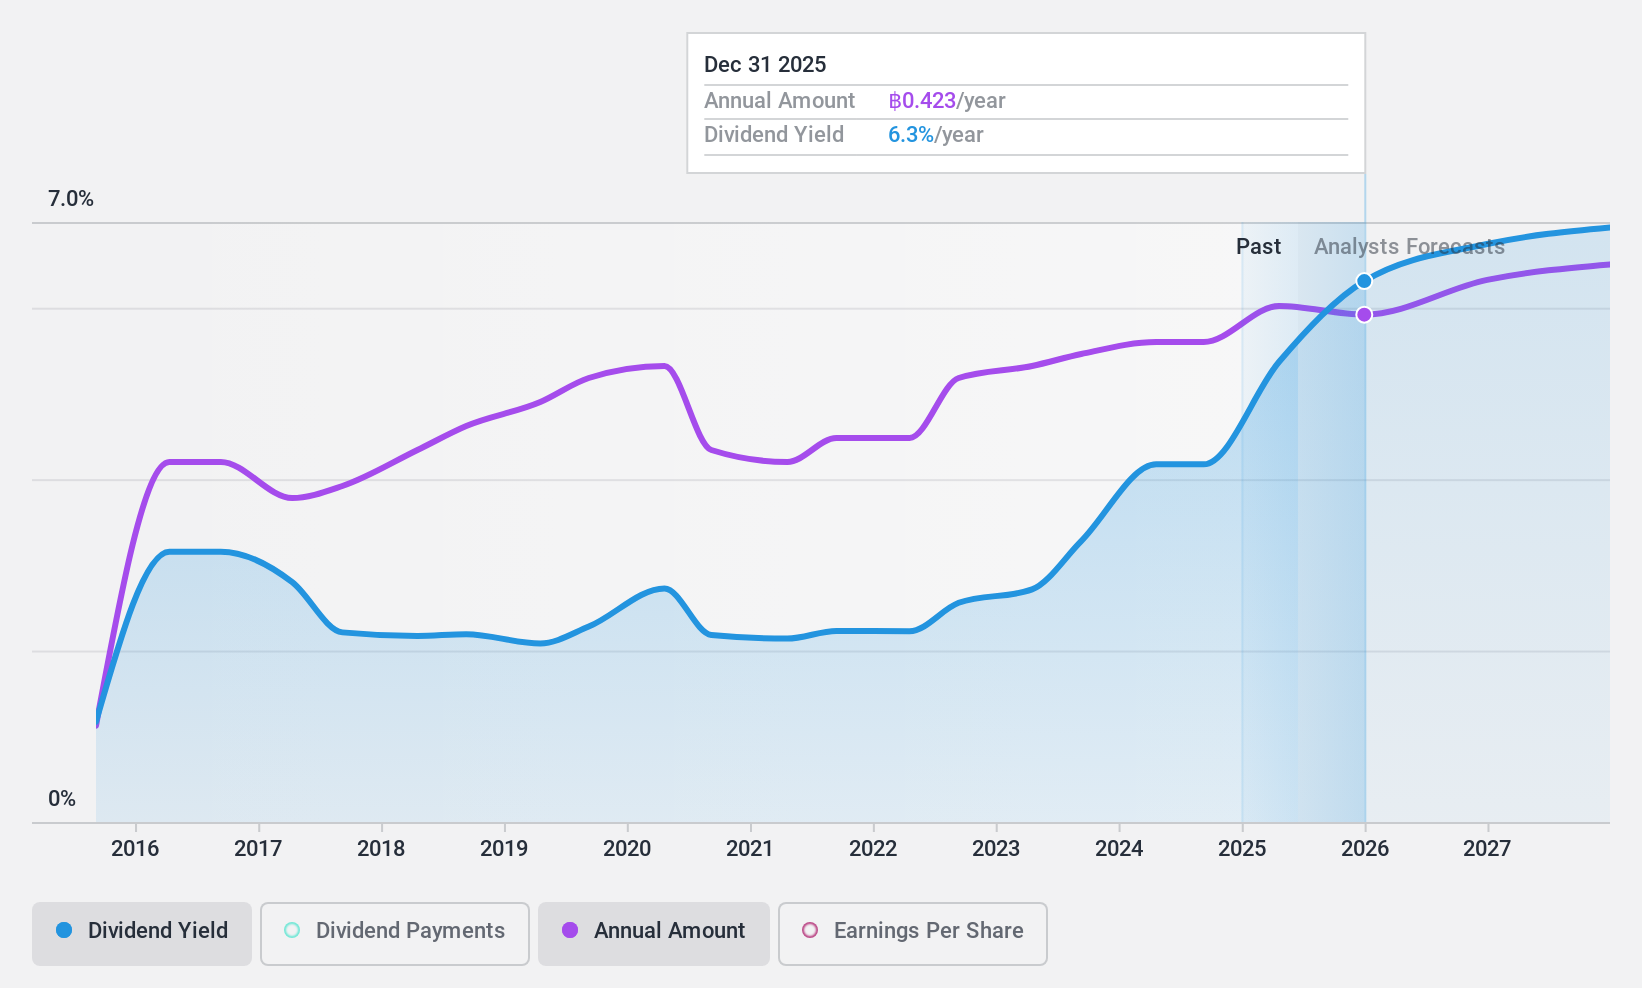
Home Product Center (SET:HMPRO)
Simply Wall St Dividend Rating: ★★★★☆☆
Overview: Home Product Center Public Company Limited operates as a home improvement retailer in Thailand, Malaysia, and Vietnam with a market cap of THB128.22 billion.
Operations: Home Product Center Public Company Limited generates revenue through its retail segment focused on building products, amounting to THB72.99 billion.
Dividend Yield: 4.1%
Home Product Center's dividend payments are well-covered by earnings (44.2% payout ratio) and cash flows (83.3% cash payout ratio). Despite a volatile and unstable dividend track record over the past decade, recent earnings have shown stability, with net income for H1 2024 at THB 3.33 billion compared to THB 3.23 billion a year ago. The stock trades at a favorable price-to-earnings ratio of 19.6x, slightly below the industry average of 20x.
- Dive into the specifics of Home Product Center here with our thorough dividend report.
- The analysis detailed in our Home Product Center valuation report hints at an deflated share price compared to its estimated value.
Make It Happen
- Gain an insight into the universe of 2074 Top Dividend Stocks by clicking here.
- Already own these companies? Bring clarity to your investment decisions by linking up your portfolio with Simply Wall St, where you can monitor all the vital signs of your stocks effortlessly.
- Streamline your investment strategy with Simply Wall St's app for free and benefit from extensive research on stocks across all corners of the world.
Interested In Other Possibilities?
- Explore high-performing small cap companies that haven't yet garnered significant analyst attention.
- Fuel your portfolio with companies showing strong growth potential, backed by optimistic outlooks both from analysts and management.
- Find companies with promising cash flow potential yet trading below their fair value.
This article by Simply Wall St is general in nature. We provide commentary based on historical data and analyst forecasts only using an unbiased methodology and our articles are not intended to be financial advice. It does not constitute a recommendation to buy or sell any stock, and does not take account of your objectives, or your financial situation. We aim to bring you long-term focused analysis driven by fundamental data. Note that our analysis may not factor in the latest price-sensitive company announcements or qualitative material. Simply Wall St has no position in any stocks mentioned.
New: Manage All Your Stock Portfolios in One Place
We've created the ultimate portfolio companion for stock investors, and it's free.
• Connect an unlimited number of Portfolios and see your total in one currency
• Be alerted to new Warning Signs or Risks via email or mobile
• Track the Fair Value of your stocks
Have feedback on this article? Concerned about the content? Get in touch with us directly. Alternatively, email editorial-team@simplywallst.com
About IDX:JKON
Jaya Konstruksi Manggala Pratama
Engages in the construction business in Indonesia.
Flawless balance sheet average dividend payer.
Market Insights

Advertisement
Community Narratives
WhiteCap Is Positioned To Profit Regardless Of Trump's Policy 
Fair Value CA$22.60|61.5% undervalued
ST
Equity Analyst and Writer
Microsoft's Evolution Will Drive Revenue to New Heights Fueled by AI
Fair Value US$360.00|30.7% overvalued
BR
Community Contributor
A CASE FOR USD$2.50 (CAD$3.44) BY 2028 (A 5-10 BAGGER)
Fair Value CA$3.44|88.1% undervalued
AG
Community Contributor