- Singapore
- /
- Real Estate
- /
- SGX:TQ5
Shareholders in Frasers Property (SGX:TQ5) have lost 48%, as stock drops 3.7% this past week


For many, the main point of investing is to generate higher returns than the overall market. But every investor is virtually certain to have both over-performing and under-performing stocks. So we wouldn't blame long term Frasers Property Limited (SGX:TQ5) shareholders for doubting their decision to hold, with the stock down 55% over a half decade.
Since Frasers Property has shed S$118m from its value in the past 7 days, let's see if the longer term decline has been driven by the business' economics.
Check out our latest analysis for Frasers Property
To paraphrase Benjamin Graham: Over the short term the market is a voting machine, but over the long term it's a weighing machine. One way to examine how market sentiment has changed over time is to look at the interaction between a company's share price and its earnings per share (EPS).
Over five years Frasers Property's earnings per share dropped significantly, falling to a loss, with the share price also lower. This was, in part, due to extraordinary items impacting earnings. Since the company has fallen to a loss making position, it's hard to compare the change in EPS with the share price change. But we would generally expect a lower price, given the situation.
The graphic below depicts how EPS has changed over time (unveil the exact values by clicking on the image).
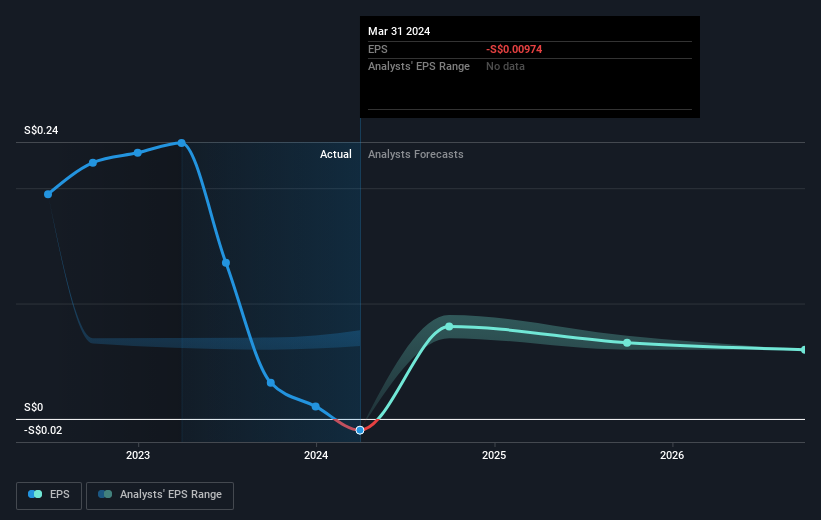
Dive deeper into Frasers Property's key metrics by checking this interactive graph of Frasers Property's earnings, revenue and cash flow.
What About Dividends?
When looking at investment returns, it is important to consider the difference between total shareholder return (TSR) and share price return. The TSR incorporates the value of any spin-offs or discounted capital raisings, along with any dividends, based on the assumption that the dividends are reinvested. Arguably, the TSR gives a more comprehensive picture of the return generated by a stock. We note that for Frasers Property the TSR over the last 5 years was -48%, which is better than the share price return mentioned above. The dividends paid by the company have thusly boosted the total shareholder return.
A Different Perspective
While the broader market lost about 0.7% in the twelve months, Frasers Property shareholders did even worse, losing 2.4% (even including dividends). However, it could simply be that the share price has been impacted by broader market jitters. It might be worth keeping an eye on the fundamentals, in case there's a good opportunity. Unfortunately, longer term shareholders are suffering worse, given the loss of 8% doled out over the last five years. We would want clear information suggesting the company will grow, before taking the view that the share price will stabilize. It's always interesting to track share price performance over the longer term. But to understand Frasers Property better, we need to consider many other factors. For instance, we've identified 2 warning signs for Frasers Property (1 doesn't sit too well with us) that you should be aware of.
If you are like me, then you will not want to miss this free list of undervalued small caps that insiders are buying.
Please note, the market returns quoted in this article reflect the market weighted average returns of stocks that currently trade on Singaporean exchanges.
New: AI Stock Screener & Alerts
Our new AI Stock Screener scans the market every day to uncover opportunities.
• Dividend Powerhouses (3%+ Yield)
• Undervalued Small Caps with Insider Buying
• High growth Tech and AI Companies
Or build your own from over 50 metrics.
Have feedback on this article? Concerned about the content? Get in touch with us directly. Alternatively, email editorial-team (at) simplywallst.com.
This article by Simply Wall St is general in nature. We provide commentary based on historical data and analyst forecasts only using an unbiased methodology and our articles are not intended to be financial advice. It does not constitute a recommendation to buy or sell any stock, and does not take account of your objectives, or your financial situation. We aim to bring you long-term focused analysis driven by fundamental data. Note that our analysis may not factor in the latest price-sensitive company announcements or qualitative material. Simply Wall St has no position in any stocks mentioned.
Have feedback on this article? Concerned about the content? Get in touch with us directly. Alternatively, email editorial-team@simplywallst.com
About SGX:TQ5
Frasers Property
An investment holding company, develops, invests in, and manages a portfolio of real estate properties.
Good value with acceptable track record.

