
Advertisement
- Singapore
- /
- Basic Materials
- /
- SGX:BAZ
A Piece Of The Puzzle Missing From Lion Asiapac Limited's (SGX:BAZ) 47% Share Price Climb
Lion Asiapac Limited (SGX:BAZ) shareholders would be excited to see that the share price has had a great month, posting a 47% gain and recovering from prior weakness. The bad news is that even after the stocks recovery in the last 30 days, shareholders are still underwater by about 5.7% over the last year.
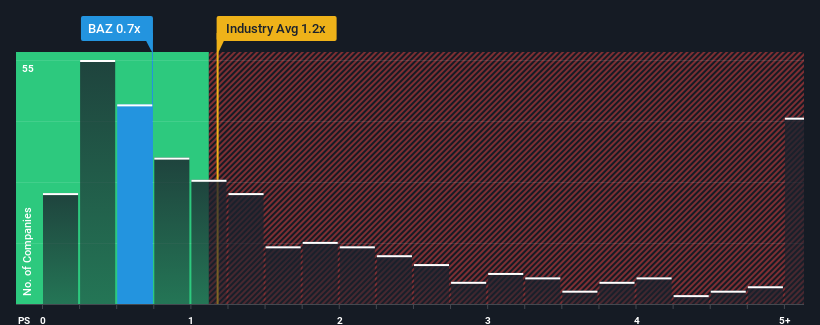
In spite of the firm bounce in price, there still wouldn't be many who think Lion Asiapac's price-to-sales (or "P/S") ratio of 0.7x is worth a mention when the median P/S in Singapore's Basic Materials industry is similar at about 0.8x. While this might not raise any eyebrows, if the P/S ratio is not justified investors could be missing out on a potential opportunity or ignoring looming disappointment.
Check out our latest analysis for Lion Asiapac
How Lion Asiapac Has Been Performing
With revenue growth that's exceedingly strong of late, Lion Asiapac has been doing very well. It might be that many expect the strong revenue performance to wane, which has kept the share price, and thus the P/S ratio, from rising. If you like the company, you'd be hoping this isn't the case so that you could potentially pick up some stock while it's not quite in favour.
We don't have analyst forecasts, but you can see how recent trends are setting up the company for the future by checking out our free report on Lion Asiapac's earnings, revenue and cash flow.What Are Revenue Growth Metrics Telling Us About The P/S?
The only time you'd be comfortable seeing a P/S like Lion Asiapac's is when the company's growth is tracking the industry closely.
Taking a look back first, we see that the company grew revenue by an impressive 51% last year. The strong recent performance means it was also able to grow revenue by 117% in total over the last three years. Accordingly, shareholders would have definitely welcomed those medium-term rates of revenue growth.
Comparing that to the industry, which is predicted to shrink 3.4% in the next 12 months, the company's positive momentum based on recent medium-term revenue results is a bright spot for the moment.
In light of this, it's peculiar that Lion Asiapac's P/S sits in line with the majority of other companies. It looks like most investors are not convinced the company can maintain its recent positive growth rate in the face of a shrinking broader industry.
The Bottom Line On Lion Asiapac's P/S
Lion Asiapac appears to be back in favour with a solid price jump bringing its P/S back in line with other companies in the industry We'd say the price-to-sales ratio's power isn't primarily as a valuation instrument but rather to gauge current investor sentiment and future expectations.
Our examination of Lion Asiapac revealed its growing revenue over the medium-term hasn't helped elevate its P/S above that of the industry, which is surprising given the industry is set to shrink. When we see a history of positive growth in a struggling industry, but only an average P/S, we assume potential risks are what might be placing pressure on the P/S ratio. Without the guidance of analysts, perhaps shareholders are feeling uncertain over whether the revenue performance can continue amidst a declining industry outlook. At least the risk of a price drop looks to be subdued, but investors seem to think future revenue could see some volatility.
Having said that, be aware Lion Asiapac is showing 3 warning signs in our investment analysis, and 2 of those are a bit concerning.
It's important to make sure you look for a great company, not just the first idea you come across. So if growing profitability aligns with your idea of a great company, take a peek at this free list of interesting companies with strong recent earnings growth (and a low P/E).
New: AI Stock Screener & Alerts
Our new AI Stock Screener scans the market every day to uncover opportunities.
• Dividend Powerhouses (3%+ Yield)
• Undervalued Small Caps with Insider Buying
• High growth Tech and AI Companies
Or build your own from over 50 metrics.
Have feedback on this article? Concerned about the content? Get in touch with us directly. Alternatively, email editorial-team (at) simplywallst.com.
This article by Simply Wall St is general in nature. We provide commentary based on historical data and analyst forecasts only using an unbiased methodology and our articles are not intended to be financial advice. It does not constitute a recommendation to buy or sell any stock, and does not take account of your objectives, or your financial situation. We aim to bring you long-term focused analysis driven by fundamental data. Note that our analysis may not factor in the latest price-sensitive company announcements or qualitative material. Simply Wall St has no position in any stocks mentioned.
About SGX:BAZ
Lion Asiapac
An investment holding company, engages in lime manufacturing and sales activities in Malaysia and Singapore.
Excellent balance sheet and good value.
Market Insights

Advertisement
Community Narratives
MicroVision will explode future revenue by 380.37% with a vision towards success
Fair Value US$60.00|98.4% undervalued
TH
Community Contributor
The Indispensable Artery for a New North American Economy
Fair Value CA$132.87|1.3% undervalued
TI
Community Contributor