
Advertisement
Even after rising 12% this past week, Del Monte Pacific (SGX:D03) shareholders are still down 64% over the past three years

This week we saw the Del Monte Pacific Limited (SGX:D03) share price climb by 12%. But that doesn't change the fact that the returns over the last three years have been disappointing. Indeed, the share price is down a tragic 67% in the last three years. So the improvement may be a real relief to some. Perhaps the company has turned over a new leaf.
While the stock has risen 12% in the past week but long term shareholders are still in the red, let's see what the fundamentals can tell us.
See our latest analysis for Del Monte Pacific
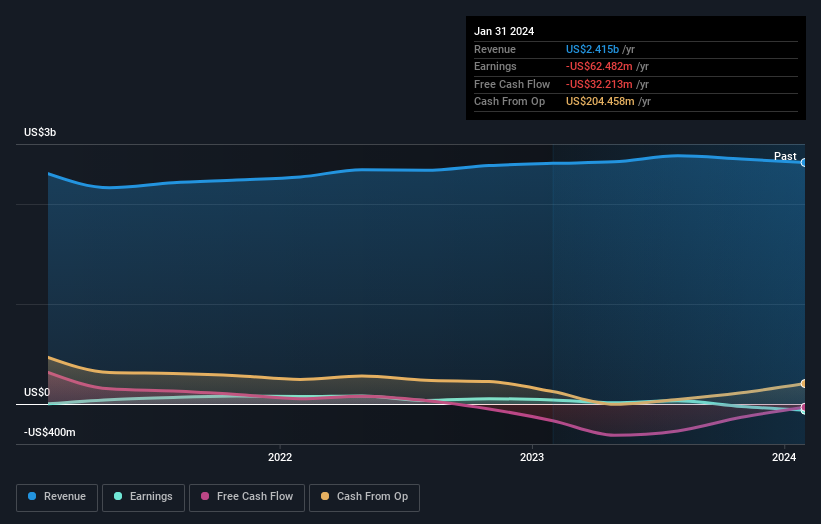
Del Monte Pacific isn't currently profitable, so most analysts would look to revenue growth to get an idea of how fast the underlying business is growing. When a company doesn't make profits, we'd generally hope to see good revenue growth. As you can imagine, fast revenue growth, when maintained, often leads to fast profit growth.
In the last three years, Del Monte Pacific saw its revenue grow by 3.8% per year, compound. Given it's losing money in pursuit of growth, we are not really impressed with that. It's likely this weak growth has contributed to an annualised return of 19% for the last three years. When a stock falls hard like this, some investors like to add the company to a watchlist (in case the business recovers, longer term). After all, growing a business isn't easy, and the process will not always be smooth.
The image below shows how earnings and revenue have tracked over time (if you click on the image you can see greater detail).
Balance sheet strength is crucial. It might be well worthwhile taking a look at our free report on how its financial position has changed over time.
What About Dividends?
It is important to consider the total shareholder return, as well as the share price return, for any given stock. The TSR incorporates the value of any spin-offs or discounted capital raisings, along with any dividends, based on the assumption that the dividends are reinvested. Arguably, the TSR gives a more comprehensive picture of the return generated by a stock. As it happens, Del Monte Pacific's TSR for the last 3 years was -64%, which exceeds the share price return mentioned earlier. The dividends paid by the company have thusly boosted the total shareholder return.
A Different Perspective
While the broader market gained around 0.8% in the last year, Del Monte Pacific shareholders lost 53% (even including dividends). Even the share prices of good stocks drop sometimes, but we want to see improvements in the fundamental metrics of a business, before getting too interested. Longer term investors wouldn't be so upset, since they would have made 2%, each year, over five years. If the fundamental data continues to indicate long term sustainable growth, the current sell-off could be an opportunity worth considering. It's always interesting to track share price performance over the longer term. But to understand Del Monte Pacific better, we need to consider many other factors. To that end, you should be aware of the 1 warning sign we've spotted with Del Monte Pacific .
If you would prefer to check out another company -- one with potentially superior financials -- then do not miss this free list of companies that have proven they can grow earnings.
Please note, the market returns quoted in this article reflect the market weighted average returns of stocks that currently trade on Singaporean exchanges.
New: Manage All Your Stock Portfolios in One Place
We've created the ultimate portfolio companion for stock investors, and it's free.
• Connect an unlimited number of Portfolios and see your total in one currency
• Be alerted to new Warning Signs or Risks via email or mobile
• Track the Fair Value of your stocks
Have feedback on this article? Concerned about the content? Get in touch with us directly. Alternatively, email editorial-team (at) simplywallst.com.
This article by Simply Wall St is general in nature. We provide commentary based on historical data and analyst forecasts only using an unbiased methodology and our articles are not intended to be financial advice. It does not constitute a recommendation to buy or sell any stock, and does not take account of your objectives, or your financial situation. We aim to bring you long-term focused analysis driven by fundamental data. Note that our analysis may not factor in the latest price-sensitive company announcements or qualitative material. Simply Wall St has no position in any stocks mentioned.
About SGX:D03
Del Monte Pacific
An investment holding company, manufactures, processes, markets, and distributes food, beverages, and other related products in the Americas, the Asia Pacific, and Europe.
Good value with mediocre balance sheet.
Similar Companies
Market Insights


Advertisement
Community Narratives
Alphabet: The Under-appreciated Compounder Hiding in Plain Sight
Fair Value US$282.83|30.5% undervalued
BL
Community Contributor
Planet Labs: At The Heart Of The Emerging New Space Boom
Fair Value US$11.31|45.3% undervalued
AN
Community Contributor
Exxon in Guyana 5 year forecast Low $135 to High $189
Fair Value US$189.00|40.3% undervalued
AG
Community Contributor