
Advertisement
- Singapore
- /
- Energy Services
- /
- SGX:C13
CH Offshore Ltd. (SGX:C13) Stock's 35% Dive Might Signal An Opportunity But It Requires Some Scrutiny
The CH Offshore Ltd. (SGX:C13) share price has fared very poorly over the last month, falling by a substantial 35%. The drop over the last 30 days has capped off a tough year for shareholders, with the share price down 41% in that time.
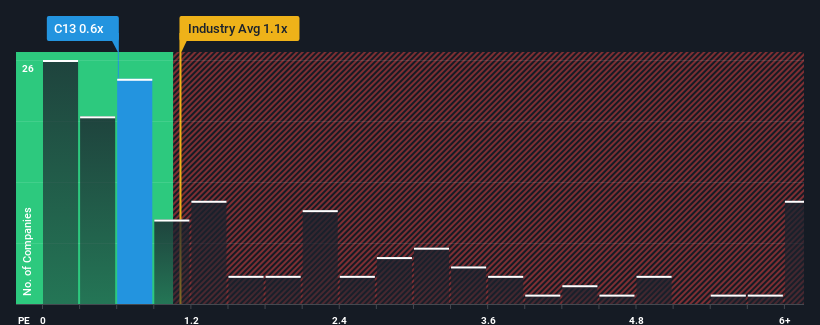
Even after such a large drop in price, it's still not a stretch to say that CH Offshore's price-to-sales (or "P/S") ratio of 0.6x right now seems quite "middle-of-the-road" compared to the Energy Services industry in Singapore, seeing as it matches the P/S ratio of the wider industry. While this might not raise any eyebrows, if the P/S ratio is not justified investors could be missing out on a potential opportunity or ignoring looming disappointment.
View our latest analysis for CH Offshore
How CH Offshore Has Been Performing
The revenue growth achieved at CH Offshore over the last year would be more than acceptable for most companies. It might be that many expect the respectable revenue performance to wane, which has kept the P/S from rising. If that doesn't eventuate, then existing shareholders probably aren't too pessimistic about the future direction of the share price.
We don't have analyst forecasts, but you can see how recent trends are setting up the company for the future by checking out our free report on CH Offshore's earnings, revenue and cash flow.What Are Revenue Growth Metrics Telling Us About The P/S?
In order to justify its P/S ratio, CH Offshore would need to produce growth that's similar to the industry.
Taking a look back first, we see that the company managed to grow revenues by a handy 8.9% last year. Pleasingly, revenue has also lifted 69% in aggregate from three years ago, partly thanks to the last 12 months of growth. Accordingly, shareholders would have definitely welcomed those medium-term rates of revenue growth.
Comparing that to the industry, which is only predicted to deliver 13% growth in the next 12 months, the company's momentum is stronger based on recent medium-term annualised revenue results.
With this information, we find it interesting that CH Offshore is trading at a fairly similar P/S compared to the industry. It may be that most investors are not convinced the company can maintain its recent growth rates.
What We Can Learn From CH Offshore's P/S?
With its share price dropping off a cliff, the P/S for CH Offshore looks to be in line with the rest of the Energy Services industry. It's argued the price-to-sales ratio is an inferior measure of value within certain industries, but it can be a powerful business sentiment indicator.
To our surprise, CH Offshore revealed its three-year revenue trends aren't contributing to its P/S as much as we would have predicted, given they look better than current industry expectations. When we see strong revenue with faster-than-industry growth, we can only assume potential risks are what might be placing pressure on the P/S ratio. At least the risk of a price drop looks to be subdued if recent medium-term revenue trends continue, but investors seem to think future revenue could see some volatility.
Before you take the next step, you should know about the 1 warning sign for CH Offshore that we have uncovered.
If companies with solid past earnings growth is up your alley, you may wish to see this free collection of other companies with strong earnings growth and low P/E ratios.
New: AI Stock Screener & Alerts
Our new AI Stock Screener scans the market every day to uncover opportunities.
• Dividend Powerhouses (3%+ Yield)
• Undervalued Small Caps with Insider Buying
• High growth Tech and AI Companies
Or build your own from over 50 metrics.
Have feedback on this article? Concerned about the content? Get in touch with us directly. Alternatively, email editorial-team (at) simplywallst.com.
This article by Simply Wall St is general in nature. We provide commentary based on historical data and analyst forecasts only using an unbiased methodology and our articles are not intended to be financial advice. It does not constitute a recommendation to buy or sell any stock, and does not take account of your objectives, or your financial situation. We aim to bring you long-term focused analysis driven by fundamental data. Note that our analysis may not factor in the latest price-sensitive company announcements or qualitative material. Simply Wall St has no position in any stocks mentioned.
About SGX:C13
CH Offshore
An investment holding company, owns and charters vessels in Singapore, Malaysia, Indonesia, Mexico, Africa, India, and Brunei.
Flawless balance sheet with acceptable track record.
Market Insights

Advertisement
Community Narratives
MicroVision will explode future revenue by 380.37% with a vision towards success
Fair Value US$60.00|98.5% undervalued
TH
Community Contributor
The Indispensable Artery for a New North American Economy
Fair Value CA$132.87|2.3% undervalued
TI
Community Contributor