
Advertisement
- Singapore
- /
- Construction
- /
- SGX:5TT
Keong Hong Holdings Limited (SGX:5TT) Soars 34% But It's A Story Of Risk Vs Reward
Those holding Keong Hong Holdings Limited (SGX:5TT) shares would be relieved that the share price has rebounded 34% in the last thirty days, but it needs to keep going to repair the recent damage it has caused to investor portfolios. The bad news is that even after the stocks recovery in the last 30 days, shareholders are still underwater by about 3.1% over the last year.
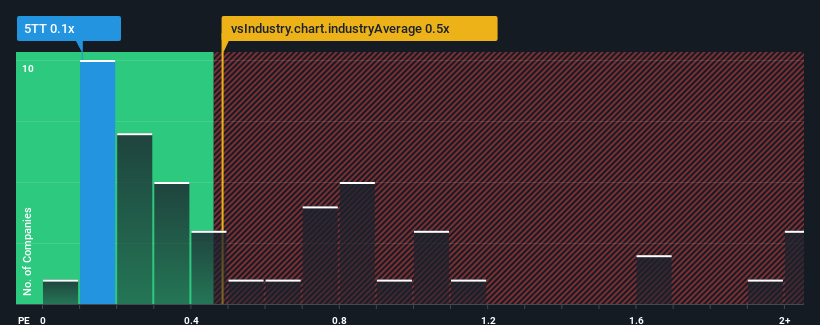
Even after such a large jump in price, you could still be forgiven for feeling indifferent about Keong Hong Holdings' P/S ratio of 0.1x, since the median price-to-sales (or "P/S") ratio for the Construction industry in Singapore is also close to 0.5x. While this might not raise any eyebrows, if the P/S ratio is not justified investors could be missing out on a potential opportunity or ignoring looming disappointment.
See our latest analysis for Keong Hong Holdings
What Does Keong Hong Holdings' P/S Mean For Shareholders?
With revenue growth that's exceedingly strong of late, Keong Hong Holdings has been doing very well. Perhaps the market is expecting future revenue performance to taper off, which has kept the P/S from rising. Those who are bullish on Keong Hong Holdings will be hoping that this isn't the case, so that they can pick up the stock at a lower valuation.
Want the full picture on earnings, revenue and cash flow for the company? Then our free report on Keong Hong Holdings will help you shine a light on its historical performance.Is There Some Revenue Growth Forecasted For Keong Hong Holdings?
Keong Hong Holdings' P/S ratio would be typical for a company that's only expected to deliver moderate growth, and importantly, perform in line with the industry.
Taking a look back first, we see that the company grew revenue by an impressive 67% last year. The strong recent performance means it was also able to grow revenue by 106% in total over the last three years. Accordingly, shareholders would have definitely welcomed those medium-term rates of revenue growth.
When compared to the industry's one-year growth forecast of 9.2%, the most recent medium-term revenue trajectory is noticeably more alluring
With this information, we find it interesting that Keong Hong Holdings is trading at a fairly similar P/S compared to the industry. Apparently some shareholders believe the recent performance is at its limits and have been accepting lower selling prices.
What Does Keong Hong Holdings' P/S Mean For Investors?
Keong Hong Holdings appears to be back in favour with a solid price jump bringing its P/S back in line with other companies in the industry Generally, our preference is to limit the use of the price-to-sales ratio to establishing what the market thinks about the overall health of a company.
To our surprise, Keong Hong Holdings revealed its three-year revenue trends aren't contributing to its P/S as much as we would have predicted, given they look better than current industry expectations. When we see strong revenue with faster-than-industry growth, we can only assume potential risks are what might be placing pressure on the P/S ratio. It appears some are indeed anticipating revenue instability, because the persistence of these recent medium-term conditions would normally provide a boost to the share price.
Before you take the next step, you should know about the 4 warning signs for Keong Hong Holdings (2 are potentially serious!) that we have uncovered.
If you're unsure about the strength of Keong Hong Holdings' business, why not explore our interactive list of stocks with solid business fundamentals for some other companies you may have missed.
Valuation is complex, but we're here to simplify it.
Discover if Keong Hong Holdings might be undervalued or overvalued with our detailed analysis, featuring fair value estimates, potential risks, dividends, insider trades, and its financial condition.
Access Free AnalysisHave feedback on this article? Concerned about the content? Get in touch with us directly. Alternatively, email editorial-team (at) simplywallst.com.
This article by Simply Wall St is general in nature. We provide commentary based on historical data and analyst forecasts only using an unbiased methodology and our articles are not intended to be financial advice. It does not constitute a recommendation to buy or sell any stock, and does not take account of your objectives, or your financial situation. We aim to bring you long-term focused analysis driven by fundamental data. Note that our analysis may not factor in the latest price-sensitive company announcements or qualitative material. Simply Wall St has no position in any stocks mentioned.
About SGX:5TT
Keong Hong Holdings
An investment holding company, engages in the building construction, and property and hotel development activities in Singapore and Maldives.
Excellent balance sheet and good value.
Market Insights

Advertisement
Community Narratives
MINISO's fair value is projected at 26.69 with an anticipated PE ratio shift of 20x
Fair Value US$24.03|12.0% undervalued
BE
Community Contributor
Procter & Gamble: A Dividend Giant Facing Slowing Growth
Fair Value US$119.81|21.7% overvalued
AN
Community Contributor
Eli Lilly's Future Growth Driven by Tirzepatide and Favorable Market Conditions
Fair Value US$1.19k|14.1% undervalued
EA
Community Contributor