- Sweden
- /
- Tech Hardware
- /
- OM:TOBII
What Tobii AB (publ)'s (STO:TOBII) 27% Share Price Gain Is Not Telling You

Those holding Tobii AB (publ) (STO:TOBII) shares would be relieved that the share price has rebounded 27% in the last thirty days, but it needs to keep going to repair the recent damage it has caused to investor portfolios. Still, the 30-day jump doesn't change the fact that longer term shareholders have seen their stock decimated by the 81% share price drop in the last twelve months.
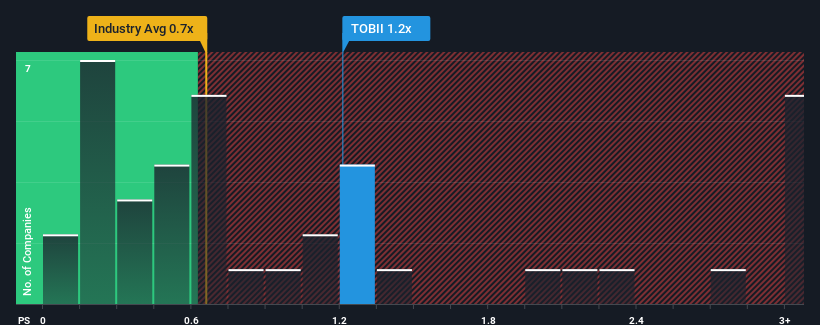
Even after such a large jump in price, you could still be forgiven for feeling indifferent about Tobii's P/S ratio of 1.2x, since the median price-to-sales (or "P/S") ratio for the Tech industry in Sweden is about the same. While this might not raise any eyebrows, if the P/S ratio is not justified investors could be missing out on a potential opportunity or ignoring looming disappointment.
Check out our latest analysis for Tobii
What Does Tobii's P/S Mean For Shareholders?
Tobii hasn't been tracking well recently as its declining revenue compares poorly to other companies, which have seen some growth in their revenues on average. One possibility is that the P/S ratio is moderate because investors think this poor revenue performance will turn around. However, if this isn't the case, investors might get caught out paying too much for the stock.
Want the full picture on analyst estimates for the company? Then our free report on Tobii will help you uncover what's on the horizon.What Are Revenue Growth Metrics Telling Us About The P/S?
In order to justify its P/S ratio, Tobii would need to produce growth that's similar to the industry.
In reviewing the last year of financials, we were disheartened to see the company's revenues fell to the tune of 2.3%. However, a few very strong years before that means that it was still able to grow revenue by an impressive 31% in total over the last three years. Accordingly, while they would have preferred to keep the run going, shareholders would definitely welcome the medium-term rates of revenue growth.
Shifting to the future, estimates from the one analyst covering the company suggest revenue should grow by 0.8% over the next year. That's shaping up to be materially lower than the 3.5% growth forecast for the broader industry.
With this in mind, we find it intriguing that Tobii's P/S is closely matching its industry peers. Apparently many investors in the company are less bearish than analysts indicate and aren't willing to let go of their stock right now. These shareholders may be setting themselves up for future disappointment if the P/S falls to levels more in line with the growth outlook.
The Bottom Line On Tobii's P/S
Its shares have lifted substantially and now Tobii's P/S is back within range of the industry median. We'd say the price-to-sales ratio's power isn't primarily as a valuation instrument but rather to gauge current investor sentiment and future expectations.
Given that Tobii's revenue growth projections are relatively subdued in comparison to the wider industry, it comes as a surprise to see it trading at its current P/S ratio. When we see companies with a relatively weaker revenue outlook compared to the industry, we suspect the share price is at risk of declining, sending the moderate P/S lower. Circumstances like this present a risk to current and prospective investors who may see share prices fall if the low revenue growth impacts the sentiment.
It is also worth noting that we have found 4 warning signs for Tobii (2 are concerning!) that you need to take into consideration.
If strong companies turning a profit tickle your fancy, then you'll want to check out this free list of interesting companies that trade on a low P/E (but have proven they can grow earnings).
The New Payments ETF Is Live on NASDAQ:
Money is moving to real-time rails, and a newly listed ETF now gives investors direct exposure. Fast settlement. Institutional custody. Simple access.
Explore how this launch could reshape portfolios
Sponsored ContentValuation is complex, but we're here to simplify it.
Discover if Tobii might be undervalued or overvalued with our detailed analysis, featuring fair value estimates, potential risks, dividends, insider trades, and its financial condition.
Access Free AnalysisHave feedback on this article? Concerned about the content? Get in touch with us directly. Alternatively, email editorial-team (at) simplywallst.com.
This article by Simply Wall St is general in nature. We provide commentary based on historical data and analyst forecasts only using an unbiased methodology and our articles are not intended to be financial advice. It does not constitute a recommendation to buy or sell any stock, and does not take account of your objectives, or your financial situation. We aim to bring you long-term focused analysis driven by fundamental data. Note that our analysis may not factor in the latest price-sensitive company announcements or qualitative material. Simply Wall St has no position in any stocks mentioned.
About OM:TOBII
Tobii
Develops and sells eye-tracking technology and solutions in Sweden, Europe, Middle East, Africa, the United States, and internationally.
Adequate balance sheet and slightly overvalued.
Similar Companies
Market Insights

Weekly Picks

Early mover in a fast growing industry. Likely to experience share price volatility as they scale


A case for CA$31.80 (undiluted), aka 8,616% upside from CA$0.37 (an 86 bagger!).


Moderation and Stabilisation: HOLD: Fair Price based on a 4-year Cycle is $12.08
Recently Updated Narratives


Title: Market Sentiment Is Dead Wrong — Here's Why PSEC Deserves a Second Look


An amazing opportunity to potentially get a 100 bagger

Amazon: Why the World’s Biggest Platform Still Runs on Invisible Economics
Popular Narratives


Crazy Undervalued 42 Baggers Silver Play (Active & Running Mine)


MicroVision will explode future revenue by 380.37% with a vision towards success


NVDA: Expanding AI Demand Will Drive Major Data Center Investments Through 2026
Trending Discussion
