- Sweden
- /
- Electronic Equipment and Components
- /
- OM:BERNER B
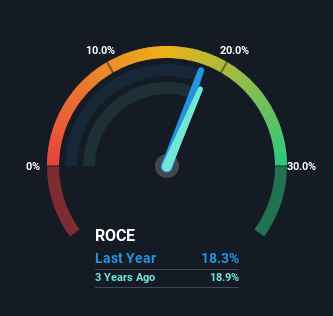
Returns On Capital At Christian Berner Tech Trade (STO:CBTT B) Have Stalled

What are the early trends we should look for to identify a stock that could multiply in value over the long term? One common approach is to try and find a company with returns on capital employed (ROCE) that are increasing, in conjunction with a growing amount of capital employed. If you see this, it typically means it's a company with a great business model and plenty of profitable reinvestment opportunities. With that in mind, the ROCE of Christian Berner Tech Trade (STO:CBTT B) looks decent, right now, so lets see what the trend of returns can tell us.
What Is Return On Capital Employed (ROCE)?
If you haven't worked with ROCE before, it measures the 'return' (pre-tax profit) a company generates from capital employed in its business. The formula for this calculation on Christian Berner Tech Trade is:
Return on Capital Employed = Earnings Before Interest and Tax (EBIT) ÷ (Total Assets - Current Liabilities)
0.18 = kr54m ÷ (kr673m - kr379m) (Based on the trailing twelve months to June 2023).
Thus, Christian Berner Tech Trade has an ROCE of 18%. That's a pretty standard return and it's in line with the industry average of 18%.
Check out our latest analysis for Christian Berner Tech Trade
Above you can see how the current ROCE for Christian Berner Tech Trade compares to its prior returns on capital, but there's only so much you can tell from the past. If you'd like to see what analysts are forecasting going forward, you should check out our free report for Christian Berner Tech Trade.
What Does the ROCE Trend For Christian Berner Tech Trade Tell Us?
While the returns on capital are good, they haven't moved much. The company has consistently earned 18% for the last five years, and the capital employed within the business has risen 65% in that time. 18% is a pretty standard return, and it provides some comfort knowing that Christian Berner Tech Trade has consistently earned this amount. Stable returns in this ballpark can be unexciting, but if they can be maintained over the long run, they often provide nice rewards to shareholders.
On a separate but related note, it's important to know that Christian Berner Tech Trade has a current liabilities to total assets ratio of 56%, which we'd consider pretty high. This can bring about some risks because the company is basically operating with a rather large reliance on its suppliers or other sorts of short-term creditors. While it's not necessarily a bad thing, it can be beneficial if this ratio is lower.
In Conclusion...
In the end, Christian Berner Tech Trade has proven its ability to adequately reinvest capital at good rates of return. In light of this, the stock has only gained 19% over the last five years for shareholders who have owned the stock in this period. That's why it could be worth your time looking into this stock further to discover if it has more traits of a multi-bagger.
On a separate note, we've found 3 warning signs for Christian Berner Tech Trade you'll probably want to know about.
If you want to search for solid companies with great earnings, check out this free list of companies with good balance sheets and impressive returns on equity.
Mobile Infrastructure for Defense and Disaster
The next wave in robotics isn't humanoid. Its fully autonomous towers delivering 5G, ISR, and radar in under 30 minutes, anywhere.
Get the investor briefing before the next round of contracts
Sponsored On Behalf of CiTechValuation is complex, but we're here to simplify it.
Discover if Berner Industrier might be undervalued or overvalued with our detailed analysis, featuring fair value estimates, potential risks, dividends, insider trades, and its financial condition.
Access Free AnalysisHave feedback on this article? Concerned about the content? Get in touch with us directly. Alternatively, email editorial-team (at) simplywallst.com.
This article by Simply Wall St is general in nature. We provide commentary based on historical data and analyst forecasts only using an unbiased methodology and our articles are not intended to be financial advice. It does not constitute a recommendation to buy or sell any stock, and does not take account of your objectives, or your financial situation. We aim to bring you long-term focused analysis driven by fundamental data. Note that our analysis may not factor in the latest price-sensitive company announcements or qualitative material. Simply Wall St has no position in any stocks mentioned.
About OM:BERNER B
Berner Industrier
Engages in the technology distribution, and energy and environment business in Sweden, Norway, Finland, and Denmark.
Outstanding track record with flawless balance sheet.
Market Insights

Weekly Picks

Early mover in a fast growing industry. Likely to experience share price volatility as they scale


A case for CA$31.80 (undiluted), aka 8,616% upside from CA$0.37 (an 86 bagger!).


Moderation and Stabilisation: HOLD: Fair Price based on a 4-year Cycle is $12.08
Recently Updated Narratives

Airbnb Stock: Platform Growth in a World of Saturation and Scrutiny

Adobe Stock: AI-Fueled ARR Growth Pushes Guidance Higher, But Cost Pressures Loom

Thomson Reuters Stock: When Legal Intelligence Becomes Mission-Critical Infrastructure
Popular Narratives


Crazy Undervalued 42 Baggers Silver Play (Active & Running Mine)


NVDA: Expanding AI Demand Will Drive Major Data Center Investments Through 2026

The AI Infrastructure Giant Grows Into Its Valuation
Trending Discussion


