We're Not Very Worried About Sustainion Group's (NGM:SUSG) Cash Burn Rate
There's no doubt that money can be made by owning shares of unprofitable businesses. Indeed, Sustainion Group (NGM:SUSG) stock is up 132% in the last year, providing strong gains for shareholders. Nonetheless, only a fool would ignore the risk that a loss making company burns through its cash too quickly.
Given its strong share price performance, we think it's worthwhile for Sustainion Group shareholders to consider whether its cash burn is concerning. For the purposes of this article, cash burn is the annual rate at which an unprofitable company spends cash to fund its growth; its negative free cash flow. Let's start with an examination of the business' cash, relative to its cash burn.
Check out our latest analysis for Sustainion Group
Does Sustainion Group Have A Long Cash Runway?
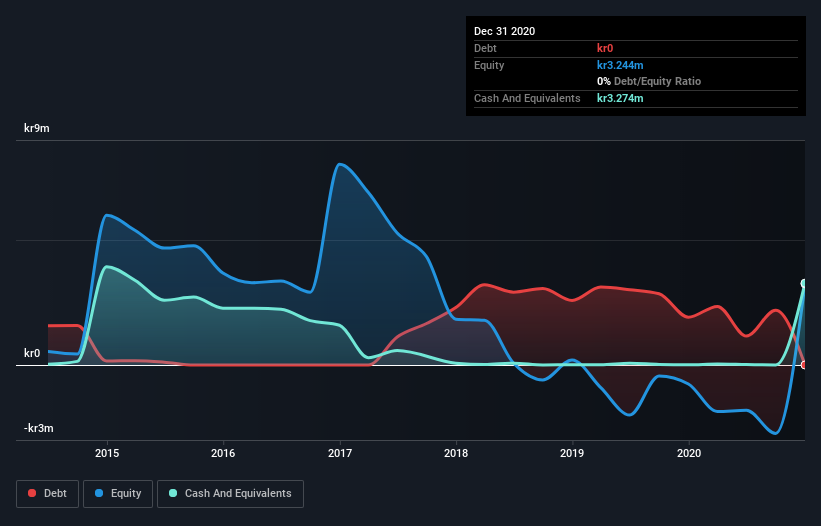
A company's cash runway is calculated by dividing its cash hoard by its cash burn. As at December 2020, Sustainion Group had cash of kr3.3m and no debt. Looking at the last year, the company burnt through kr1.2m. Therefore, from December 2020 it had 2.7 years of cash runway. That's decent, giving the company a couple years to develop its business. You can see how its cash balance has changed over time in the image below.

How Well Is Sustainion Group Growing?
It was fairly positive to see that Sustainion Group reduced its cash burn by 34% during the last year. Unfortunately, however, operating revenue declined by 4.2% during the period. On balance, we'd say the company is improving over time. In reality, this article only makes a short study of the company's growth data. This graph of historic earnings and revenue shows how Sustainion Group is building its business over time.
Can Sustainion Group Raise More Cash Easily?
While Sustainion Group seems to be in a decent position, we reckon it is still worth thinking about how easily it could raise more cash, if that proved desirable. Companies can raise capital through either debt or equity. Commonly, a business will sell new shares in itself to raise cash and drive growth. By looking at a company's cash burn relative to its market capitalisation, we gain insight on how much shareholders would be diluted if the company needed to raise enough cash to cover another year's cash burn.
Sustainion Group's cash burn of kr1.2m is about 0.6% of its kr208m market capitalisation. So it could almost certainly just borrow a little to fund another year's growth, or else easily raise the cash by issuing a few shares.
So, Should We Worry About Sustainion Group's Cash Burn?
As you can probably tell by now, we're not too worried about Sustainion Group's cash burn. In particular, we think its cash burn relative to its market cap stands out as evidence that the company is well on top of its spending. Although its falling revenue does give us reason for pause, the other metrics we discussed in this article form a positive picture overall. After taking into account the various metrics mentioned in this report, we're pretty comfortable with how the company is spending its cash. On another note, we conducted an in-depth investigation of the company, and identified 4 warning signs for Sustainion Group (1 is a bit concerning!) that you should be aware of before investing here.
Of course, you might find a fantastic investment by looking elsewhere. So take a peek at this free list of companies insiders are buying, and this list of stocks growth stocks (according to analyst forecasts)
If you decide to trade Sustainion Group, use the lowest-cost* platform that is rated #1 Overall by Barron’s, Interactive Brokers. Trade stocks, options, futures, forex, bonds and funds on 135 markets, all from a single integrated account. Promoted
New: Manage All Your Stock Portfolios in One Place
We've created the ultimate portfolio companion for stock investors, and it's free.
• Connect an unlimited number of Portfolios and see your total in one currency
• Be alerted to new Warning Signs or Risks via email or mobile
• Track the Fair Value of your stocks
This article by Simply Wall St is general in nature. It does not constitute a recommendation to buy or sell any stock, and does not take account of your objectives, or your financial situation. We aim to bring you long-term focused analysis driven by fundamental data. Note that our analysis may not factor in the latest price-sensitive company announcements or qualitative material. Simply Wall St has no position in any stocks mentioned.
*Interactive Brokers Rated Lowest Cost Broker by StockBrokers.com Annual Online Review 2020
Have feedback on this article? Concerned about the content? Get in touch with us directly. Alternatively, email editorial-team (at) simplywallst.com.
About NGM:SUSG
Sustainion Group
Through its subsidiaries, develops and sells security products in Sweden.
Adequate balance sheet slight.
Market Insights
Community Narratives


