
Advertisement
Further Upside For mySafety Group AB (STO:SAFETY B) Shares Could Introduce Price Risks After 26% Bounce
Despite an already strong run, mySafety Group AB (STO:SAFETY B) shares have been powering on, with a gain of 26% in the last thirty days. Notwithstanding the latest gain, the annual share price return of 3.3% isn't as impressive.
In spite of the firm bounce in price, you could still be forgiven for feeling indifferent about mySafety Group's P/S ratio of 0.6x, since the median price-to-sales (or "P/S") ratio for the IT industry in Sweden is also close to 0.9x. However, investors might be overlooking a clear opportunity or potential setback if there is no rational basis for the P/S.
Check out our latest analysis for mySafety Group
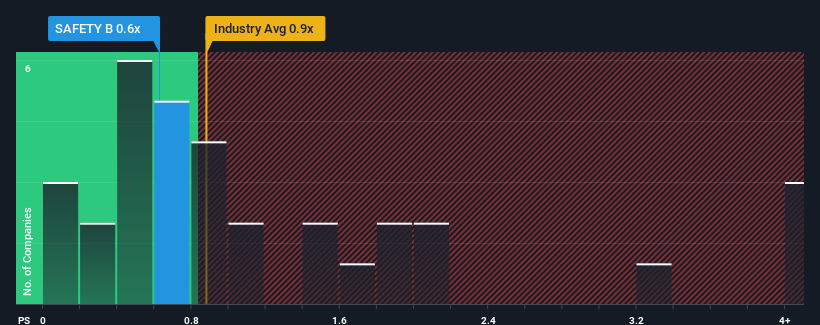
How mySafety Group Has Been Performing
Revenue has risen at a steady rate over the last year for mySafety Group, which is generally not a bad outcome. It might be that many expect the respectable revenue performance to only match most other companies over the coming period, which has kept the P/S from rising. If you like the company, you'd be hoping this isn't the case so that you could potentially pick up some stock while it's not quite in favour.
Want the full picture on earnings, revenue and cash flow for the company? Then our free report on mySafety Group will help you shine a light on its historical performance.How Is mySafety Group's Revenue Growth Trending?
In order to justify its P/S ratio, mySafety Group would need to produce growth that's similar to the industry.
If we review the last year of revenue growth, the company posted a worthy increase of 2.6%. While this performance is only fair, the company was still able to deliver immense revenue growth over the last three years. Therefore, it's fair to say the revenue growth recently has been superb for the company.
Weighing the recent medium-term upward revenue trajectory against the broader industry's one-year forecast for contraction of 7.0% shows it's a great look while it lasts.
With this information, we find it odd that mySafety Group is trading at a fairly similar P/S to the industry. It looks like most investors are not convinced the company can maintain its recent positive growth rate in the face of a shrinking broader industry.
What We Can Learn From mySafety Group's P/S?
Its shares have lifted substantially and now mySafety Group's P/S is back within range of the industry median. Using the price-to-sales ratio alone to determine if you should sell your stock isn't sensible, however it can be a practical guide to the company's future prospects.
As mentioned previously, mySafety Group currently trades on a P/S on par with the wider industry, but this is lower than expected considering its recent three-year revenue growth is beating forecasts for a struggling industry. When we see a history of positive growth in a struggling industry, but only an average P/S, we assume potential risks are what might be placing pressure on the P/S ratio. Without the guidance of analysts, perhaps shareholders are feeling uncertain over whether the revenue performance can continue amidst a declining industry outlook. The fact that the company's relative performance has not provided a kick to the share price suggests that some investors are anticipating revenue instability.
Don't forget that there may be other risks. For instance, we've identified 3 warning signs for mySafety Group (2 can't be ignored) you should be aware of.
Of course, profitable companies with a history of great earnings growth are generally safer bets. So you may wish to see this free collection of other companies that have reasonable P/E ratios and have grown earnings strongly.
New: AI Stock Screener & Alerts
Our new AI Stock Screener scans the market every day to uncover opportunities.
• Dividend Powerhouses (3%+ Yield)
• Undervalued Small Caps with Insider Buying
• High growth Tech and AI Companies
Or build your own from over 50 metrics.
Have feedback on this article? Concerned about the content? Get in touch with us directly. Alternatively, email editorial-team (at) simplywallst.com.
This article by Simply Wall St is general in nature. We provide commentary based on historical data and analyst forecasts only using an unbiased methodology and our articles are not intended to be financial advice. It does not constitute a recommendation to buy or sell any stock, and does not take account of your objectives, or your financial situation. We aim to bring you long-term focused analysis driven by fundamental data. Note that our analysis may not factor in the latest price-sensitive company announcements or qualitative material. Simply Wall St has no position in any stocks mentioned.
About OM:SAFETY B
Adequate balance sheet second-rate dividend payer.
Market Insights

Advertisement
Community Narratives
The company that turned a verb into a global necessity and basically runs the modern internet, digital ads, smartphones, maps, and AI.
Fair Value US$300.00|7.5% undervalued
OS
Community Contributor
Flowers Foods Pays A Fair Price For Health
Fair Value US$16.12|25.4% undervalued
NV
Community Contributor
TMX Group will thrive with 33.3% profit margin and enduring market moat
Fair Value CA$49.90|3.6% overvalued
LI
Community Contributor
The "Molecular Pencil": Why Beam's Technology is Built to Win
Fair Value US$65.01|65.0% undervalued
DA
Community Contributor