
Advertisement
After Leaping 27% Clavister Holding AB (publ.) (STO:CLAV) Shares Are Not Flying Under The Radar
Despite an already strong run, Clavister Holding AB (publ.) (STO:CLAV) shares have been powering on, with a gain of 27% in the last thirty days. Still, the 30-day jump doesn't change the fact that longer term shareholders have seen their stock decimated by the 77% share price drop in the last twelve months.
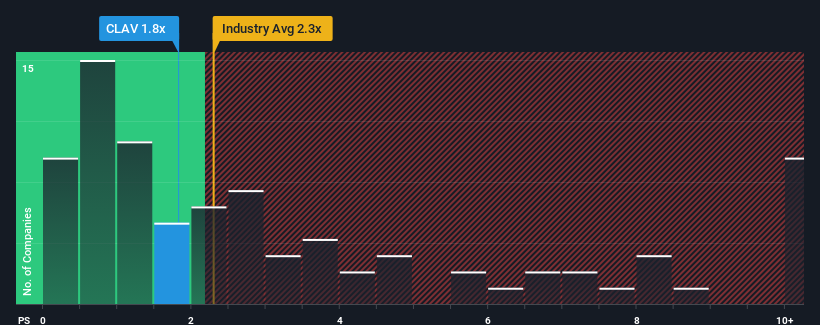
Even after such a large jump in price, it's still not a stretch to say that Clavister Holding AB (publ.)'s price-to-sales (or "P/S") ratio of 1.8x right now seems quite "middle-of-the-road" compared to the Software industry in Sweden, where the median P/S ratio is around 2.3x. Although, it's not wise to simply ignore the P/S without explanation as investors may be disregarding a distinct opportunity or a costly mistake.
Check out our latest analysis for Clavister Holding AB (publ.)
What Does Clavister Holding AB (publ.)'s P/S Mean For Shareholders?
Clavister Holding AB (publ.) could be doing better as it's been growing revenue less than most other companies lately. One possibility is that the P/S ratio is moderate because investors think this lacklustre revenue performance will turn around. If not, then existing shareholders may be a little nervous about the viability of the share price.
If you'd like to see what analysts are forecasting going forward, you should check out our free report on Clavister Holding AB (publ.).Is There Some Revenue Growth Forecasted For Clavister Holding AB (publ.)?
The only time you'd be comfortable seeing a P/S like Clavister Holding AB (publ.)'s is when the company's growth is tracking the industry closely.
Retrospectively, the last year delivered a decent 15% gain to the company's revenues. The latest three year period has also seen an excellent 34% overall rise in revenue, aided somewhat by its short-term performance. Accordingly, shareholders would have definitely welcomed those medium-term rates of revenue growth.
Turning to the outlook, the next year should generate growth of 18% as estimated by the lone analyst watching the company. With the industry predicted to deliver 17% growth , the company is positioned for a comparable revenue result.
With this information, we can see why Clavister Holding AB (publ.) is trading at a fairly similar P/S to the industry. It seems most investors are expecting to see average future growth and are only willing to pay a moderate amount for the stock.
What Does Clavister Holding AB (publ.)'s P/S Mean For Investors?
Clavister Holding AB (publ.)'s stock has a lot of momentum behind it lately, which has brought its P/S level with the rest of the industry. It's argued the price-to-sales ratio is an inferior measure of value within certain industries, but it can be a powerful business sentiment indicator.
Our look at Clavister Holding AB (publ.)'s revenue growth estimates show that its P/S is about what we expect, as both metrics follow closely with the industry averages. Right now shareholders are comfortable with the P/S as they are quite confident future revenue won't throw up any surprises. If all things remain constant, the possibility of a drastic share price movement remains fairly remote.
You should always think about risks. Case in point, we've spotted 4 warning signs for Clavister Holding AB (publ.) you should be aware of, and 2 of them don't sit too well with us.
It's important to make sure you look for a great company, not just the first idea you come across. So if growing profitability aligns with your idea of a great company, take a peek at this free list of interesting companies with strong recent earnings growth (and a low P/E).
New: AI Stock Screener & Alerts
Our new AI Stock Screener scans the market every day to uncover opportunities.
• Dividend Powerhouses (3%+ Yield)
• Undervalued Small Caps with Insider Buying
• High growth Tech and AI Companies
Or build your own from over 50 metrics.
Have feedback on this article? Concerned about the content? Get in touch with us directly. Alternatively, email editorial-team (at) simplywallst.com.
This article by Simply Wall St is general in nature. We provide commentary based on historical data and analyst forecasts only using an unbiased methodology and our articles are not intended to be financial advice. It does not constitute a recommendation to buy or sell any stock, and does not take account of your objectives, or your financial situation. We aim to bring you long-term focused analysis driven by fundamental data. Note that our analysis may not factor in the latest price-sensitive company announcements or qualitative material. Simply Wall St has no position in any stocks mentioned.
About OM:CLAV
Clavister Holding AB (publ.)
Develops, produces, and sells cybersecurity solutions in Sweden, rest of Europe, Asia, and internationally.
Reasonable growth potential and fair value.
Market Insights

Advertisement
Community Narratives
MicroVision will explode future revenue by 380.37% with a vision towards success
Fair Value US$60.00|98.4% undervalued
TH
Community Contributor
The Indispensable Artery for a New North American Economy
Fair Value CA$132.87|1.3% undervalued
TI
Community Contributor