
Advertisement
There's no doubt that investing in the stock market is a truly brilliant way to build wealth. But if when you choose to buy stocks, some of them will be below average performers. Unfortunately for shareholders, while the CAG Group AB (publ) (STO:CAG) share price is up 11% in the last year, that falls short of the market return. We'll need to follow CAG Group for a while to get a better sense of its share price trend, since it hasn't been listed for particularly long.
View our latest analysis for CAG Group
To quote Buffett, 'Ships will sail around the world but the Flat Earth Society will flourish. There will continue to be wide discrepancies between price and value in the marketplace...' One way to examine how market sentiment has changed over time is to look at the interaction between a company's share price and its earnings per share (EPS).
During the last year, CAG Group actually saw its earnings per share drop 20%.
This means it's unlikely the market is judging the company based on earnings growth. Indeed, when EPS is declining but the share price is up, it often means the market is considering other factors.
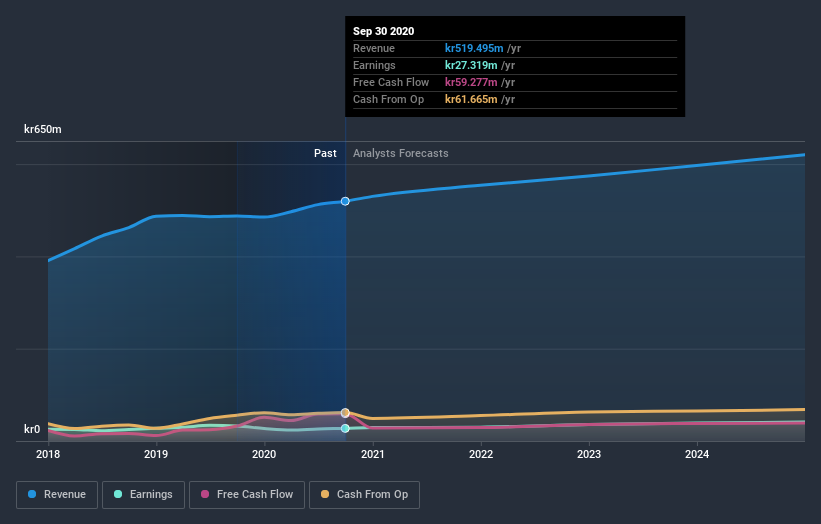
We haven't seen CAG Group increase dividend payments yet, so the yield probably hasn't helped drive the share higher. It seems far more likely that the 6.5% boost to the revenue over the last year, is making the difference. Revenue growth often does precede earnings growth, so some investors might be willing to forgo profits today because they have their eyes fixed firmly on the future.
The image below shows how earnings and revenue have tracked over time (if you click on the image you can see greater detail).
Take a more thorough look at CAG Group's financial health with this free report on its balance sheet.
What About Dividends?
As well as measuring the share price return, investors should also consider the total shareholder return (TSR). The TSR is a return calculation that accounts for the value of cash dividends (assuming that any dividend received was reinvested) and the calculated value of any discounted capital raisings and spin-offs. Arguably, the TSR gives a more comprehensive picture of the return generated by a stock. In the case of CAG Group, it has a TSR of 17% for the last year. That exceeds its share price return that we previously mentioned. The dividends paid by the company have thusly boosted the total shareholder return.
A Different Perspective
CAG Group shareholders have gained 17% over twelve months (even including dividends), which isn't far from the market return of 18%. And the stock has been on a nice little run lately, with the price climbing 13% higher in 90 days. It could be that word is spreading about its positive business attributes. It's always interesting to track share price performance over the longer term. But to understand CAG Group better, we need to consider many other factors. For instance, we've identified 2 warning signs for CAG Group that you should be aware of.
Of course, you might find a fantastic investment by looking elsewhere. So take a peek at this free list of companies we expect will grow earnings.
Please note, the market returns quoted in this article reflect the market weighted average returns of stocks that currently trade on SE exchanges.
If you decide to trade CAG Group, use the lowest-cost* platform that is rated #1 Overall by Barron’s, Interactive Brokers. Trade stocks, options, futures, forex, bonds and funds on 135 markets, all from a single integrated account. Promoted
New: AI Stock Screener & Alerts
Our new AI Stock Screener scans the market every day to uncover opportunities.
• Dividend Powerhouses (3%+ Yield)
• Undervalued Small Caps with Insider Buying
• High growth Tech and AI Companies
Or build your own from over 50 metrics.
This article by Simply Wall St is general in nature. It does not constitute a recommendation to buy or sell any stock, and does not take account of your objectives, or your financial situation. We aim to bring you long-term focused analysis driven by fundamental data. Note that our analysis may not factor in the latest price-sensitive company announcements or qualitative material. Simply Wall St has no position in any stocks mentioned.
*Interactive Brokers Rated Lowest Cost Broker by StockBrokers.com Annual Online Review 2020
Have feedback on this article? Concerned about the content? Get in touch with us directly. Alternatively, email editorial-team@simplywallst.com.
About OM:CAG
Flawless balance sheet and good value.
Market Insights

Advertisement
Community Narratives
MicroVision will explode future revenue by 380.37% with a vision towards success
Fair Value US$60.00|98.4% undervalued
TH
Community Contributor
The Indispensable Artery for a New North American Economy
Fair Value CA$132.87|1.3% undervalued
TI
Community Contributor