Stock Analysis
Is Touchtech AB's (NGM:TOUCH) Recent Stock Performance Influenced By Its Fundamentals In Any Way?


Touchtech (NGM:TOUCH) has had a great run on the share market with its stock up by a significant 11% over the last week. As most would know, fundamentals are what usually guide market price movements over the long-term, so we decided to look at the company's key financial indicators today to determine if they have any role to play in the recent price movement. Particularly, we will be paying attention to Touchtech's ROE today.
Return on Equity or ROE is a test of how effectively a company is growing its value and managing investors’ money. Put another way, it reveals the company's success at turning shareholder investments into profits.
Check out our latest analysis for Touchtech
How Do You Calculate Return On Equity?
The formula for ROE is:
Return on Equity = Net Profit (from continuing operations) ÷ Shareholders' Equity
So, based on the above formula, the ROE for Touchtech is:
7.0% = kr3.5m ÷ kr50m (Based on the trailing twelve months to March 2024).
The 'return' refers to a company's earnings over the last year. That means that for every SEK1 worth of shareholders' equity, the company generated SEK0.07 in profit.
What Is The Relationship Between ROE And Earnings Growth?
We have already established that ROE serves as an efficient profit-generating gauge for a company's future earnings. We now need to evaluate how much profit the company reinvests or "retains" for future growth which then gives us an idea about the growth potential of the company. Assuming all else is equal, companies that have both a higher return on equity and higher profit retention are usually the ones that have a higher growth rate when compared to companies that don't have the same features.
Touchtech's Earnings Growth And 7.0% ROE
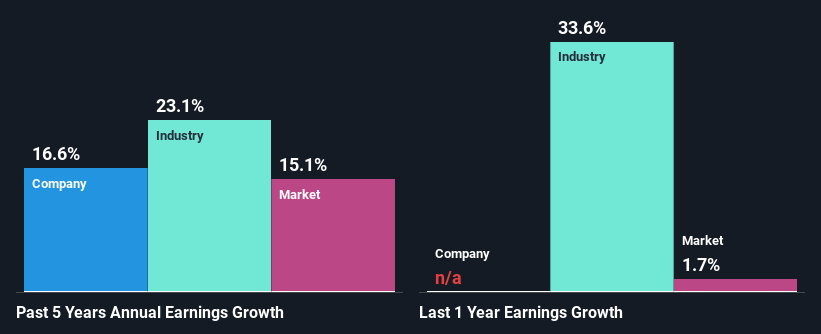
At first glance, Touchtech's ROE doesn't look very promising. Next, when compared to the average industry ROE of 14%, the company's ROE leaves us feeling even less enthusiastic. Touchtech was still able to see a decent net income growth of 17% over the past five years. So, there might be other aspects that are positively influencing the company's earnings growth. For instance, the company has a low payout ratio or is being managed efficiently.
As a next step, we compared Touchtech's net income growth with the industry and were disappointed to see that the company's growth is lower than the industry average growth of 23% in the same period.
The basis for attaching value to a company is, to a great extent, tied to its earnings growth. What investors need to determine next is if the expected earnings growth, or the lack of it, is already built into the share price. Doing so will help them establish if the stock's future looks promising or ominous. One good indicator of expected earnings growth is the P/E ratio which determines the price the market is willing to pay for a stock based on its earnings prospects. So, you may want to check if Touchtech is trading on a high P/E or a low P/E, relative to its industry.
Is Touchtech Using Its Retained Earnings Effectively?
Given that Touchtech doesn't pay any regular dividends to its shareholders, we infer that the company has been reinvesting all of its profits to grow its business.
Summary
In total, it does look like Touchtech has some positive aspects to its business. That is, a decent growth in earnings backed by a high rate of reinvestment. However, we do feel that that earnings growth could have been higher if the business were to improve on the low ROE rate. Especially given how the company is reinvesting a huge chunk of its profits. While we won't completely dismiss the company, what we would do, is try to ascertain how risky the business is to make a more informed decision around the company. To know the 3 risks we have identified for Touchtech visit our risks dashboard for free.
Valuation is complex, but we're helping make it simple.
Find out whether Touchtech is potentially over or undervalued by checking out our comprehensive analysis, which includes fair value estimates, risks and warnings, dividends, insider transactions and financial health.
View the Free AnalysisHave feedback on this article? Concerned about the content? Get in touch with us directly. Alternatively, email editorial-team (at) simplywallst.com.
This article by Simply Wall St is general in nature. We provide commentary based on historical data and analyst forecasts only using an unbiased methodology and our articles are not intended to be financial advice. It does not constitute a recommendation to buy or sell any stock, and does not take account of your objectives, or your financial situation. We aim to bring you long-term focused analysis driven by fundamental data. Note that our analysis may not factor in the latest price-sensitive company announcements or qualitative material. Simply Wall St has no position in any stocks mentioned.
Valuation is complex, but we're helping make it simple.
Find out whether Touchtech is potentially over or undervalued by checking out our comprehensive analysis, which includes fair value estimates, risks and warnings, dividends, insider transactions and financial health.
View the Free AnalysisHave feedback on this article? Concerned about the content? Get in touch with us directly. Alternatively, email editorial-team@simplywallst.com
About NGM:TOUCH
Excellent balance sheet with acceptable track record.
