Seamless Distribution Systems AB (publ)'s (NGM:SDS) Share Price Boosted 29% But Its Business Prospects Need A Lift Too

Seamless Distribution Systems AB (publ) (NGM:SDS) shareholders would be excited to see that the share price has had a great month, posting a 29% gain and recovering from prior weakness. Unfortunately, the gains of the last month did little to right the losses of the last year with the stock still down 11% over that time.
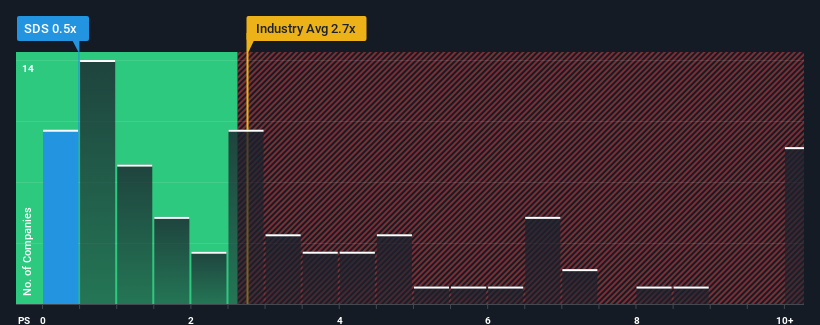
In spite of the firm bounce in price, Seamless Distribution Systems' price-to-sales (or "P/S") ratio of 0.5x might still make it look like a strong buy right now compared to the wider Software industry in Sweden, where around half of the companies have P/S ratios above 2.7x and even P/S above 6x are quite common. However, the P/S might be quite low for a reason and it requires further investigation to determine if it's justified.
Check out our latest analysis for Seamless Distribution Systems
What Does Seamless Distribution Systems' P/S Mean For Shareholders?
Seamless Distribution Systems hasn't been tracking well recently as its declining revenue compares poorly to other companies, which have seen some growth in their revenues on average. Perhaps the P/S remains low as investors think the prospects of strong revenue growth aren't on the horizon. So while you could say the stock is cheap, investors will be looking for improvement before they see it as good value.
If you'd like to see what analysts are forecasting going forward, you should check out our free report on Seamless Distribution Systems.Do Revenue Forecasts Match The Low P/S Ratio?
Seamless Distribution Systems' P/S ratio would be typical for a company that's expected to deliver very poor growth or even falling revenue, and importantly, perform much worse than the industry.
Taking a look back first, we see that there was hardly any revenue growth to speak of for the company over the past year. Whilst it's an improvement, it wasn't enough to get the company out of the hole it was in, with revenue down 7.7% overall from three years ago. So unfortunately, we have to acknowledge that the company has not done a great job of growing revenue over that time.
Turning to the outlook, the next year should bring diminished returns, with revenue decreasing 5.3% as estimated by the lone analyst watching the company. With the industry predicted to deliver 18% growth, that's a disappointing outcome.
In light of this, it's understandable that Seamless Distribution Systems' P/S would sit below the majority of other companies. However, shrinking revenues are unlikely to lead to a stable P/S over the longer term. There's potential for the P/S to fall to even lower levels if the company doesn't improve its top-line growth.
The Bottom Line On Seamless Distribution Systems' P/S
Shares in Seamless Distribution Systems have risen appreciably however, its P/S is still subdued. Using the price-to-sales ratio alone to determine if you should sell your stock isn't sensible, however it can be a practical guide to the company's future prospects.
As we suspected, our examination of Seamless Distribution Systems' analyst forecasts revealed that its outlook for shrinking revenue is contributing to its low P/S. Right now shareholders are accepting the low P/S as they concede future revenue probably won't provide any pleasant surprises. Unless there's material change, it's hard to envision a situation where the stock price will rise drastically.
Don't forget that there may be other risks. For instance, we've identified 4 warning signs for Seamless Distribution Systems (2 are concerning) you should be aware of.
If strong companies turning a profit tickle your fancy, then you'll want to check out this free list of interesting companies that trade on a low P/E (but have proven they can grow earnings).
The New Payments ETF Is Live on NASDAQ:
Money is moving to real-time rails, and a newly listed ETF now gives investors direct exposure. Fast settlement. Institutional custody. Simple access.
Explore how this launch could reshape portfolios
Sponsored ContentNew: Manage All Your Stock Portfolios in One Place
We've created the ultimate portfolio companion for stock investors, and it's free.
• Connect an unlimited number of Portfolios and see your total in one currency
• Be alerted to new Warning Signs or Risks via email or mobile
• Track the Fair Value of your stocks
Have feedback on this article? Concerned about the content? Get in touch with us directly. Alternatively, email editorial-team (at) simplywallst.com.
This article by Simply Wall St is general in nature. We provide commentary based on historical data and analyst forecasts only using an unbiased methodology and our articles are not intended to be financial advice. It does not constitute a recommendation to buy or sell any stock, and does not take account of your objectives, or your financial situation. We aim to bring you long-term focused analysis driven by fundamental data. Note that our analysis may not factor in the latest price-sensitive company announcements or qualitative material. Simply Wall St has no position in any stocks mentioned.
Have feedback on this article? Concerned about the content? Get in touch with us directly. Alternatively, email editorial-team@simplywallst.com
About NGM:SDS
Seamless Distribution Systems
Supplies payment systems for mobile phones in Africa, the Middle East, Asia, and internationally.
Slight risk with mediocre balance sheet.
Market Insights

Weekly Picks

Early mover in a fast growing industry. Likely to experience share price volatility as they scale


A case for CA$31.80 (undiluted), aka 8,616% upside from CA$0.37 (an 86 bagger!).


Moderation and Stabilisation: HOLD: Fair Price based on a 4-year Cycle is $12.08
Recently Updated Narratives


Title: Market Sentiment Is Dead Wrong — Here's Why PSEC Deserves a Second Look


An amazing opportunity to potentially get a 100 bagger

Amazon: Why the World’s Biggest Platform Still Runs on Invisible Economics
Popular Narratives


Crazy Undervalued 42 Baggers Silver Play (Active & Running Mine)


MicroVision will explode future revenue by 380.37% with a vision towards success


NVDA: Expanding AI Demand Will Drive Major Data Center Investments Through 2026
Trending Discussion
