Advertisement
- Sweden
- /
- Semiconductors
- /
- OM:SIVE
Sivers Semiconductors (OM:SIVE) Revenue Set to Grow 21% Annually, Losses Narrowing—Earnings Preview

Simply Wall St
Reviewed by Simply Wall St
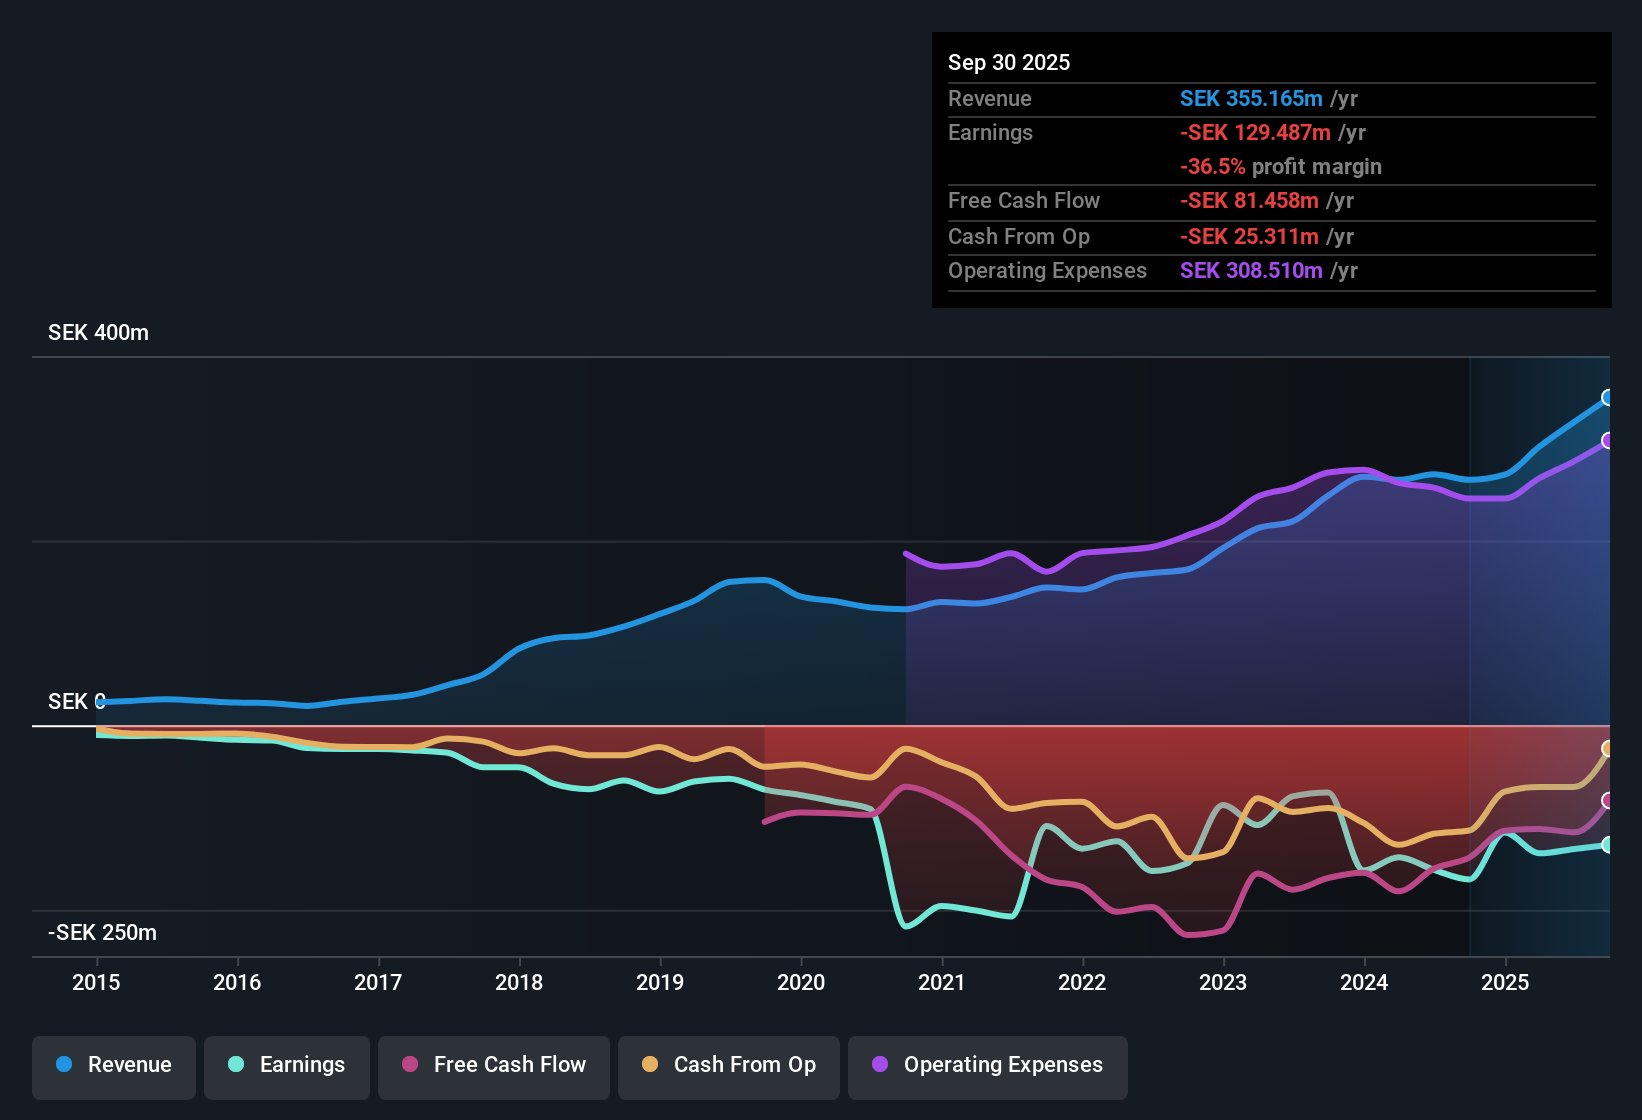
Sivers Semiconductors (OM:SIVE) remains unprofitable, but its revenue is projected to grow at an impressive 21% per year. This pace is well ahead of the Swedish market's 3.8% rate. Over the past five years, the company's losses have narrowed at a rate of 8.1% per year, though forecasts suggest it will remain in the red for at least the next three years. Investors are likely to focus on ongoing revenue growth and shrinking losses as they weigh the prospects for eventual profitability in light of the latest earnings update.
See our full analysis for Sivers Semiconductors.Now, let's see how these latest numbers stack up against the most widely followed narratives and market expectations for Sivers Semiconductors.
Curious how numbers become stories that shape markets? Explore Community Narratives
Losses Narrow at an 8.1% Annual Pace
- Over the last five years, Sivers Semiconductors reduced its annual net losses by 8.1% per year, indicating steady progress even while remaining unprofitable in the latest period.
- While hopes for profitability remain challenged by sector realities, what is surprising is how ongoing cost control and operational development have become talking points for those who see the company as positioned for long-term advantage.
- Supporters highlight the repeated narrowing of losses as proof that Sivers can capture the benefits from its investments in 5G and photonics, balancing near-term pain with future potential.
- At the same time, critics looking at the persistent negative bottom line argue that efficiency gains alone are not enough to offset the hurdles to meaningful earnings, especially in a cyclical sector.
Price-to-Sales: Discount Versus Peers, Premium to Industry
- Sivers trades at a Price-To-Sales ratio of 3.3x, which is notably lower than its peer average of 8.1x, yet above the European semiconductor sector average of 2.3x.
- Perspective on the valuation is mixed. When compared to direct peers, the lower multiple heavily supports arguments that the stock is relatively undervalued. However, relative to the wider industry, the above-average metric challenges the idea that the shares are cheap on a sector-wide basis.
- This contrast underpins why bulls may see a bargain where others see modest over-pricing, especially as the growth story is balanced by ongoing losses.
- Furthermore, the sector’s support for firms in 5G and photonics could justify a modest premium, but investors still need to decide whether Sivers’ potential is differentiated enough to warrant it.
Share Price Stands Well Above DCF Fair Value
- The current share price of SEK3.72 is nearly three times higher than the DCF fair value estimate of SEK1.28, highlighting a meaningful gap between market optimism and calculated fundamentals.
- Prevailing analysis notes that while sector enthusiasm for Sivers’ exposure to long-term structural trends creates share price momentum, this disconnect with intrinsic value remains a point of caution for valuation-focused investors.
- Bulls often look past modest over-valuation if top-line growth and commercial milestones arrive as hoped, but so far the market is pricing in expectations well ahead of conservative fair value models.
- Meanwhile, investors with a preference for fundamental valuations might see the gap as an indication to wait for either price consolidation or a step-change in profitability metrics.
Next Steps
Don't just look at this quarter; the real story is in the long-term trend. We've done an in-depth analysis on Sivers Semiconductors's growth and its valuation to see if today's price is a bargain. Add the company to your watchlist or portfolio now so you don't miss the next big move.
See What Else Is Out There
Sivers Semiconductors' ongoing losses and the wide disconnect between its share price and intrinsic value highlight risks for investors seeking better value and clearer upside.
If you want more attractive entry points, use these 879 undervalued stocks based on cash flows to uncover companies trading closer to their fundamental worth and offering a stronger margin of safety.
This article by Simply Wall St is general in nature. We provide commentary based on historical data and analyst forecasts only using an unbiased methodology and our articles are not intended to be financial advice. It does not constitute a recommendation to buy or sell any stock, and does not take account of your objectives, or your financial situation. We aim to bring you long-term focused analysis driven by fundamental data. Note that our analysis may not factor in the latest price-sensitive company announcements or qualitative material. Simply Wall St has no position in any stocks mentioned.
New: Manage All Your Stock Portfolios in One Place
We've created the ultimate portfolio companion for stock investors, and it's free.
• Connect an unlimited number of Portfolios and see your total in one currency
• Be alerted to new Warning Signs or Risks via email or mobile
• Track the Fair Value of your stocks
Have feedback on this article? Concerned about the content? Get in touch with us directly. Alternatively, email editorial-team@simplywallst.com
About OM:SIVE
Sivers Semiconductors
Through its subsidiaries, develops, manufactures, and sells chips, components, modules, and subsystems in North America, Europe, and Asia.
Excellent balance sheet with low risk.
Market Insights

Advertisement
Community Narratives
Finding The True Value Of A Logistics Powerhouse
Fair Value US$95.21|8.4% undervalued
NV
Community Contributor
Paradigm Biopharmaceuticals Will Lead Osteoarthritis Treatment with Zilosul's FDA Success
Fair Value AU$5.50|92.1% undervalued
AM
Community Contributor
Barrick Mining (ABX:CA): A Gold Hedge against a U.S. Shutdown
Fair Value CA$60.00|24.2% undervalued
GM
Community Contributor