
Advertisement
- Sweden
- /
- Specialty Stores
- /
- OM:HM B
Should You Like H & M Hennes & Mauritz AB (publ)’s (STO:HM B) High Return On Capital Employed?

Today we are going to look at H & M Hennes & Mauritz AB (publ) (STO:HM B) to see whether it might be an attractive investment prospect. Specifically, we're going to calculate its Return On Capital Employed (ROCE), in the hopes of getting some insight into the business.
First up, we'll look at what ROCE is and how we calculate it. Second, we'll look at its ROCE compared to similar companies. Last but not least, we'll look at what impact its current liabilities have on its ROCE.
Return On Capital Employed (ROCE): What is it?
ROCE measures the amount of pre-tax profits a company can generate from the capital employed in its business. In general, businesses with a higher ROCE are usually better quality. Ultimately, it is a useful but imperfect metric. Renowned investment researcher Michael Mauboussin has suggested that a high ROCE can indicate that 'one dollar invested in the company generates value of more than one dollar'.
So, How Do We Calculate ROCE?
Analysts use this formula to calculate return on capital employed:
Return on Capital Employed = Earnings Before Interest and Tax (EBIT) ÷ (Total Assets - Current Liabilities)
Or for H & M Hennes & Mauritz:
0.23 = kr16b ÷ (kr128b - kr59b) (Based on the trailing twelve months to August 2019.)
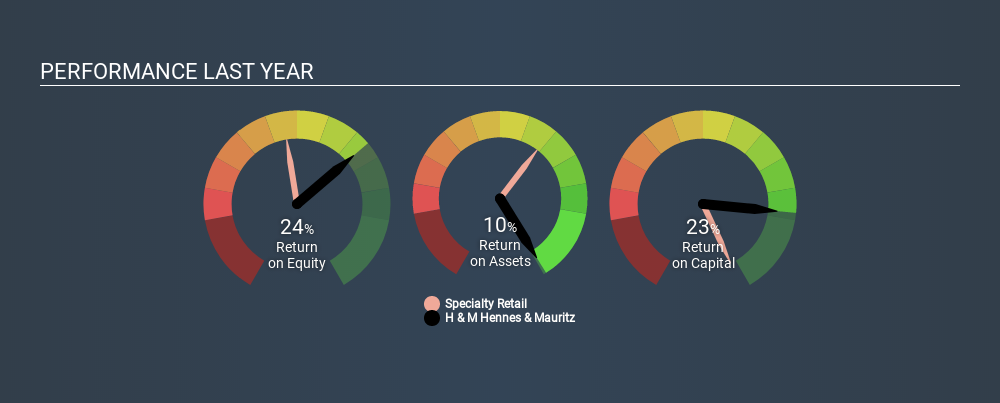
So, H & M Hennes & Mauritz has an ROCE of 23%.
View our latest analysis for H & M Hennes & Mauritz
Is H & M Hennes & Mauritz's ROCE Good?
When making comparisons between similar businesses, investors may find ROCE useful. Using our data, we find that H & M Hennes & Mauritz's ROCE is meaningfully better than the 9.6% average in the Specialty Retail industry. We would consider this a positive, as it suggests it is using capital more effectively than other similar companies. Putting aside its position relative to its industry for now, in absolute terms, H & M Hennes & Mauritz's ROCE is currently very good.
We can see that, H & M Hennes & Mauritz currently has an ROCE of 23%, less than the 40% it reported 3 years ago. This makes us wonder if the business is facing new challenges. Take a look at the image below to see how H & M Hennes & Mauritz's past growth compares to the average in its industry.
Remember that this metric is backwards looking - it shows what has happened in the past, and does not accurately predict the future. ROCE can be deceptive for cyclical businesses, as returns can look incredible in boom times, and terribly low in downturns. ROCE is only a point-in-time measure. Since the future is so important for investors, you should check out our free report on analyst forecasts for H & M Hennes & Mauritz.
Do H & M Hennes & Mauritz's Current Liabilities Skew Its ROCE?
Current liabilities are short term bills and invoices that need to be paid in 12 months or less. Due to the way the ROCE equation works, having large bills due in the near term can make it look as though a company has less capital employed, and thus a higher ROCE than usual. To counter this, investors can check if a company has high current liabilities relative to total assets.
H & M Hennes & Mauritz has total liabilities of kr59b and total assets of kr128b. Therefore its current liabilities are equivalent to approximately 46% of its total assets. H & M Hennes & Mauritz has a medium level of current liabilities, boosting its ROCE somewhat.
The Bottom Line On H & M Hennes & Mauritz's ROCE
Despite this, it reports a high ROCE, and may be worth investigating further. H & M Hennes & Mauritz looks strong on this analysis, but there are plenty of other companies that could be a good opportunity . Here is a free list of companies growing earnings rapidly.
If you are like me, then you will not want to miss this free list of growing companies that insiders are buying.
If you spot an error that warrants correction, please contact the editor at editorial-team@simplywallst.com. This article by Simply Wall St is general in nature. It does not constitute a recommendation to buy or sell any stock, and does not take account of your objectives, or your financial situation. Simply Wall St has no position in the stocks mentioned.
We aim to bring you long-term focused research analysis driven by fundamental data. Note that our analysis may not factor in the latest price-sensitive company announcements or qualitative material. Thank you for reading.
About OM:HM B
H & M Hennes & Mauritz
Provides clothing, accessories, footwear, cosmetics, home textiles, and homeware for women, men, and children worldwide.
Excellent balance sheet and fair value.
Similar Companies
Market Insights


Advertisement
Community Narratives
MicroStrategy: Volatile Gamble or Golden Opportunity?
Fair Value US$663.00|32.0% undervalued
BL
Community Contributor
Emerging Markets and Debt Reduction Will Propel Bath & Body Works Forward
Fair Value US$40.73|21.7% undervalued
ZW
Community Contributor
An amazing opportunity to potentially get a 100 bagger
Fair Value US$10.00|0.5% overvalued
DA
Community Contributor