
Advertisement
- Sweden
- /
- Real Estate
- /
- NGM:SAMT B
Samtrygg Group AB (publ)'s (NGM:SAMT B) Fundamentals Look Pretty Strong: Could The Market Be Wrong About The Stock?
Samtrygg Group (NGM:SAMT B) has had a rough three months with its share price down 10.0%. However, the company's fundamentals look pretty decent, and long-term financials are usually aligned with future market price movements. In this article, we decided to focus on Samtrygg Group's ROE.
Return on Equity or ROE is a test of how effectively a company is growing its value and managing investors’ money. In short, ROE shows the profit each dollar generates with respect to its shareholder investments.
Check out our latest analysis for Samtrygg Group
How Do You Calculate Return On Equity?
The formula for ROE is:
Return on Equity = Net Profit (from continuing operations) ÷ Shareholders' Equity
So, based on the above formula, the ROE for Samtrygg Group is:
4.7% = kr607k ÷ kr13m (Based on the trailing twelve months to June 2020).
The 'return' is the income the business earned over the last year. So, this means that for every SEK1 of its shareholder's investments, the company generates a profit of SEK0.05.
What Is The Relationship Between ROE And Earnings Growth?
Thus far, we have learned that ROE measures how efficiently a company is generating its profits. We now need to evaluate how much profit the company reinvests or "retains" for future growth which then gives us an idea about the growth potential of the company. Generally speaking, other things being equal, firms with a high return on equity and profit retention, have a higher growth rate than firms that don’t share these attributes.
Samtrygg Group's Earnings Growth And 4.7% ROE
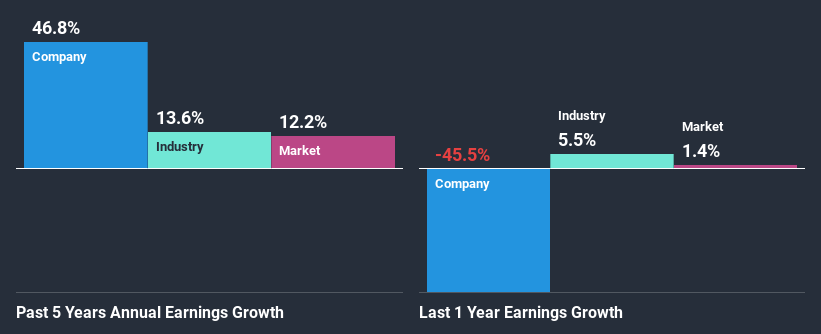
When you first look at it, Samtrygg Group's ROE doesn't look that attractive. Next, when compared to the average industry ROE of 11%, the company's ROE leaves us feeling even less enthusiastic. In spite of this, Samtrygg Group was able to grow its net income considerably, at a rate of 47% in the last five years. We reckon that there could be other factors at play here. For instance, the company has a low payout ratio or is being managed efficiently.
We then compared Samtrygg Group's net income growth with the industry and we're pleased to see that the company's growth figure is higher when compared with the industry which has a growth rate of 14% in the same period.
Earnings growth is a huge factor in stock valuation. It’s important for an investor to know whether the market has priced in the company's expected earnings growth (or decline). By doing so, they will have an idea if the stock is headed into clear blue waters or if swampy waters await. One good indicator of expected earnings growth is the P/E ratio which determines the price the market is willing to pay for a stock based on its earnings prospects. So, you may want to check if Samtrygg Group is trading on a high P/E or a low P/E, relative to its industry.
Is Samtrygg Group Making Efficient Use Of Its Profits?
Conclusion
Overall, we feel that Samtrygg Group certainly does have some positive factors to consider. With a high rate of reinvestment, albeit at a low ROE, the company has managed to see a considerable growth in its earnings. While we won't completely dismiss the company, what we would do, is try to ascertain how risky the business is to make a more informed decision around the company. To know the 5 risks we have identified for Samtrygg Group visit our risks dashboard for free.
When trading Samtrygg Group or any other investment, use the platform considered by many to be the Professional's Gateway to the Worlds Market, Interactive Brokers. You get the lowest-cost* trading on stocks, options, futures, forex, bonds and funds worldwide from a single integrated account. Promoted
New: Manage All Your Stock Portfolios in One Place
We've created the ultimate portfolio companion for stock investors, and it's free.
• Connect an unlimited number of Portfolios and see your total in one currency
• Be alerted to new Warning Signs or Risks via email or mobile
• Track the Fair Value of your stocks
This article by Simply Wall St is general in nature. It does not constitute a recommendation to buy or sell any stock, and does not take account of your objectives, or your financial situation. We aim to bring you long-term focused analysis driven by fundamental data. Note that our analysis may not factor in the latest price-sensitive company announcements or qualitative material. Simply Wall St has no position in any stocks mentioned.
*Interactive Brokers Rated Lowest Cost Broker by StockBrokers.com Annual Online Review 2020
Have feedback on this article? Concerned about the content? Get in touch with us directly. Alternatively, email editorial-team@simplywallst.com.
About NGM:SAMT B
Samtrygg Group
Operates an online marketplace for safe housing rental in Sweden.
Slight risk and slightly overvalued.
Market Insights

Advertisement
Community Narratives
MINISO's fair value is projected at 26.69 with an anticipated PE ratio shift of 20x
Fair Value US$24.03|11.0% undervalued
BE
Community Contributor
Procter & Gamble: A Dividend Giant Facing Slowing Growth
Fair Value US$119.81|23.3% overvalued
AN
Community Contributor
Eli Lilly's Future Growth Driven by Tirzepatide and Favorable Market Conditions
Fair Value US$1.19k|13.8% undervalued
EA
Community Contributor