- Sweden
- /
- Real Estate
- /
- OM:NYF
Swelling losses haven't held back gains for Nyfosa (STO:NYF) shareholders since they're up 74% over 1 year


Passive investing in index funds can generate returns that roughly match the overall market. But you can significantly boost your returns by picking above-average stocks. To wit, the Nyfosa AB (publ) (STO:NYF) share price is 67% higher than it was a year ago, much better than the market return of around 16% (not including dividends) in the same period. That's a solid performance by our standards! Unfortunately the longer term returns are not so good, with the stock falling 13% in the last three years.
While the stock has fallen 5.9% this week, it's worth focusing on the longer term and seeing if the stocks historical returns have been driven by the underlying fundamentals.
Check out our latest analysis for Nyfosa
There is no denying that markets are sometimes efficient, but prices do not always reflect underlying business performance. One way to examine how market sentiment has changed over time is to look at the interaction between a company's share price and its earnings per share (EPS).
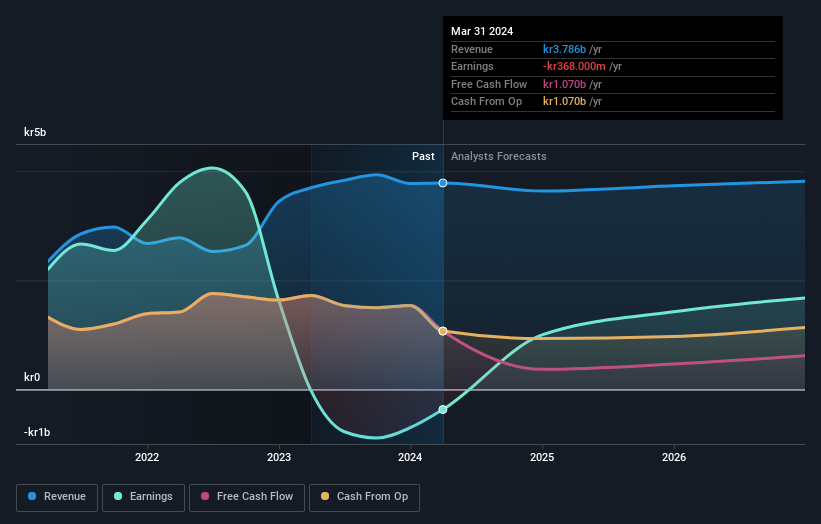
Over the last twelve months, Nyfosa actually shrank its EPS by 1,497%. We do note that there were extraordinary items impacting the result.
Given the share price gain, we doubt the market is measuring progress with EPS. Therefore, it seems likely that investors are putting more weight on metrics other than EPS, at the moment.
Revenue was pretty stable on last year, so deeper research might be needed to explain the share price rise.
The image below shows how earnings and revenue have tracked over time (if you click on the image you can see greater detail).
We consider it positive that insiders have made significant purchases in the last year. Having said that, most people consider earnings and revenue growth trends to be a more meaningful guide to the business. So it makes a lot of sense to check out what analysts think Nyfosa will earn in the future (free profit forecasts).
What About The Total Shareholder Return (TSR)?
Investors should note that there's a difference between Nyfosa's total shareholder return (TSR) and its share price change, which we've covered above. The TSR attempts to capture the value of dividends (as if they were reinvested) as well as any spin-offs or discounted capital raisings offered to shareholders. Nyfosa's TSR of 74% for the 1 year exceeded its share price return, because it has paid dividends.
A Different Perspective
It's nice to see that Nyfosa shareholders have received a total shareholder return of 74% over the last year. That gain is better than the annual TSR over five years, which is 14%. Therefore it seems like sentiment around the company has been positive lately. Someone with an optimistic perspective could view the recent improvement in TSR as indicating that the business itself is getting better with time. It's always interesting to track share price performance over the longer term. But to understand Nyfosa better, we need to consider many other factors. Like risks, for instance. Every company has them, and we've spotted 3 warning signs for Nyfosa (of which 1 is concerning!) you should know about.
There are plenty of other companies that have insiders buying up shares. You probably do not want to miss this free list of undervalued small cap companies that insiders are buying.
Please note, the market returns quoted in this article reflect the market weighted average returns of stocks that currently trade on Swedish exchanges.
Valuation is complex, but we're here to simplify it.
Discover if Nyfosa might be undervalued or overvalued with our detailed analysis, featuring fair value estimates, potential risks, dividends, insider trades, and its financial condition.
Access Free AnalysisHave feedback on this article? Concerned about the content? Get in touch with us directly. Alternatively, email editorial-team (at) simplywallst.com.
This article by Simply Wall St is general in nature. We provide commentary based on historical data and analyst forecasts only using an unbiased methodology and our articles are not intended to be financial advice. It does not constitute a recommendation to buy or sell any stock, and does not take account of your objectives, or your financial situation. We aim to bring you long-term focused analysis driven by fundamental data. Note that our analysis may not factor in the latest price-sensitive company announcements or qualitative material. Simply Wall St has no position in any stocks mentioned.
About OM:NYF
Nyfosa
A transaction-intensive real estate company, invests, manages, develops, and sells properties in Sweden, Norway, and Finland.
Moderate growth potential low.

