Lacklustre Performance Is Driving Viaplay Group AB (publ)'s (STO:VPLAY B) 62% Price Drop
Unfortunately for some shareholders, the Viaplay Group AB (publ) (STO:VPLAY B) share price has dived 62% in the last thirty days, prolonging recent pain. The recent drop completes a disastrous twelve months for shareholders, who are sitting on a 100% loss during that time.
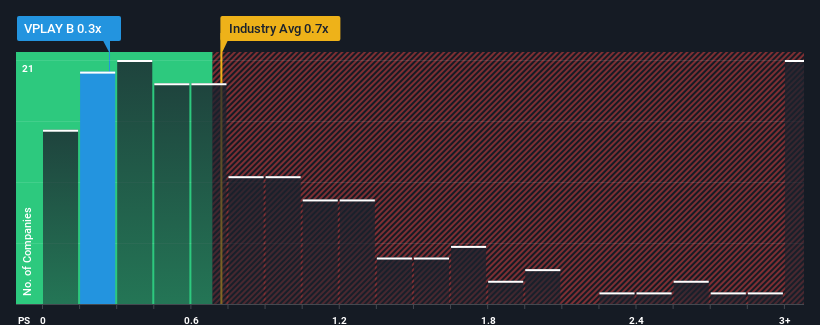
Following the heavy fall in price, Viaplay Group may be sending bullish signals at the moment with its price-to-sales (or "P/S") ratio of 0.3x, since almost half of all companies in the Media industry in Sweden have P/S ratios greater than 0.8x and even P/S higher than 3x are not unusual. Although, it's not wise to just take the P/S at face value as there may be an explanation why it's limited.
View our latest analysis for Viaplay Group

How Has Viaplay Group Performed Recently?
With revenue growth that's superior to most other companies of late, Viaplay Group has been doing relatively well. One possibility is that the P/S ratio is low because investors think this strong revenue performance might be less impressive moving forward. If you like the company, you'd be hoping this isn't the case so that you could potentially pick up some stock while it's out of favour.
If you'd like to see what analysts are forecasting going forward, you should check out our free report on Viaplay Group.Is There Any Revenue Growth Forecasted For Viaplay Group?
Viaplay Group's P/S ratio would be typical for a company that's only expected to deliver limited growth, and importantly, perform worse than the industry.
Retrospectively, the last year delivered an exceptional 26% gain to the company's top line. The latest three year period has also seen an excellent 45% overall rise in revenue, aided by its short-term performance. So we can start by confirming that the company has done a great job of growing revenue over that time.
Shifting to the future, estimates from the five analysts covering the company suggest revenue growth is heading into negative territory, declining 1.2% over the next year. With the industry predicted to deliver 15% growth, that's a disappointing outcome.
With this in consideration, we find it intriguing that Viaplay Group's P/S is closely matching its industry peers. Nonetheless, there's no guarantee the P/S has reached a floor yet with revenue going in reverse. Even just maintaining these prices could be difficult to achieve as the weak outlook is weighing down the shares.
What Does Viaplay Group's P/S Mean For Investors?
The southerly movements of Viaplay Group's shares means its P/S is now sitting at a pretty low level. It's argued the price-to-sales ratio is an inferior measure of value within certain industries, but it can be a powerful business sentiment indicator.
With revenue forecasts that are inferior to the rest of the industry, it's no surprise that Viaplay Group's P/S is on the lower end of the spectrum. At this stage investors feel the potential for an improvement in revenue isn't great enough to justify a higher P/S ratio. It's hard to see the share price rising strongly in the near future under these circumstances.
Don't forget that there may be other risks. For instance, we've identified 3 warning signs for Viaplay Group that you should be aware of.
If companies with solid past earnings growth is up your alley, you may wish to see this free collection of other companies with strong earnings growth and low P/E ratios.
New: Manage All Your Stock Portfolios in One Place
We've created the ultimate portfolio companion for stock investors, and it's free.
• Connect an unlimited number of Portfolios and see your total in one currency
• Be alerted to new Warning Signs or Risks via email or mobile
• Track the Fair Value of your stocks
Have feedback on this article? Concerned about the content? Get in touch with us directly. Alternatively, email editorial-team (at) simplywallst.com.
This article by Simply Wall St is general in nature. We provide commentary based on historical data and analyst forecasts only using an unbiased methodology and our articles are not intended to be financial advice. It does not constitute a recommendation to buy or sell any stock, and does not take account of your objectives, or your financial situation. We aim to bring you long-term focused analysis driven by fundamental data. Note that our analysis may not factor in the latest price-sensitive company announcements or qualitative material. Simply Wall St has no position in any stocks mentioned.
About OM:VPLAY B
Viaplay Group
Operates as an entertainment provider company in Sweden, rest of Nordics, rest of Europe, and internationally.
Excellent balance sheet and slightly overvalued.
Similar Companies
Market Insights
Community Narratives


