
Advertisement
- Sweden
- /
- Entertainment
- /
- OM:FRAG
Market Cool On Fragbite Group AB (publ)'s (STO:FRAG) Revenues Pushing Shares 28% Lower
Fragbite Group AB (publ) (STO:FRAG) shareholders that were waiting for something to happen have been dealt a blow with a 28% share price drop in the last month. The recent drop completes a disastrous twelve months for shareholders, who are sitting on a 67% loss during that time.
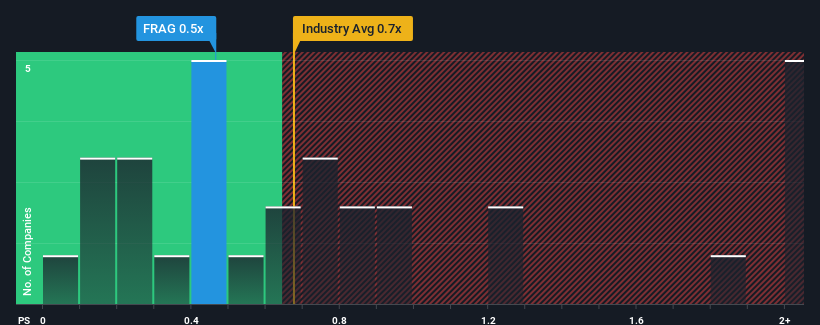
Even after such a large drop in price, it's still not a stretch to say that Fragbite Group's price-to-sales (or "P/S") ratio of 0.5x right now seems quite "middle-of-the-road" compared to the Entertainment industry in Sweden, where the median P/S ratio is around 0.7x. However, investors might be overlooking a clear opportunity or potential setback if there is no rational basis for the P/S.
View our latest analysis for Fragbite Group
How Has Fragbite Group Performed Recently?
Recent times haven't been great for Fragbite Group as its revenue has been rising slower than most other companies. One possibility is that the P/S ratio is moderate because investors think this lacklustre revenue performance will turn around. You'd really hope so, otherwise you're paying a relatively elevated price for a company with this sort of growth profile.
Want the full picture on analyst estimates for the company? Then our free report on Fragbite Group will help you uncover what's on the horizon.How Is Fragbite Group's Revenue Growth Trending?
The only time you'd be comfortable seeing a P/S like Fragbite Group's is when the company's growth is tracking the industry closely.
Taking a look back first, we see that there was hardly any revenue growth to speak of for the company over the past year. Spectacularly, three year revenue growth has ballooned by several orders of magnitude, even though the last 12 months were nothing to write home about. Accordingly, shareholders will be pleased, but also have some serious questions to ponder about the last 12 months.
Turning to the outlook, the next three years should generate growth of 43% per annum as estimated by the one analyst watching the company. That's shaping up to be materially higher than the 3.8% each year growth forecast for the broader industry.
With this in consideration, we find it intriguing that Fragbite Group's P/S is closely matching its industry peers. Apparently some shareholders are skeptical of the forecasts and have been accepting lower selling prices.
The Final Word
Following Fragbite Group's share price tumble, its P/S is just clinging on to the industry median P/S. Typically, we'd caution against reading too much into price-to-sales ratios when settling on investment decisions, though it can reveal plenty about what other market participants think about the company.
We've established that Fragbite Group currently trades on a lower than expected P/S since its forecasted revenue growth is higher than the wider industry. Perhaps uncertainty in the revenue forecasts are what's keeping the P/S ratio consistent with the rest of the industry. This uncertainty seems to be reflected in the share price which, while stable, could be higher given the revenue forecasts.
You should always think about risks. Case in point, we've spotted 4 warning signs for Fragbite Group you should be aware of, and 2 of them are a bit unpleasant.
Of course, profitable companies with a history of great earnings growth are generally safer bets. So you may wish to see this free collection of other companies that have reasonable P/E ratios and have grown earnings strongly.
New: AI Stock Screener & Alerts
Our new AI Stock Screener scans the market every day to uncover opportunities.
• Dividend Powerhouses (3%+ Yield)
• Undervalued Small Caps with Insider Buying
• High growth Tech and AI Companies
Or build your own from over 50 metrics.
Have feedback on this article? Concerned about the content? Get in touch with us directly. Alternatively, email editorial-team (at) simplywallst.com.
This article by Simply Wall St is general in nature. We provide commentary based on historical data and analyst forecasts only using an unbiased methodology and our articles are not intended to be financial advice. It does not constitute a recommendation to buy or sell any stock, and does not take account of your objectives, or your financial situation. We aim to bring you long-term focused analysis driven by fundamental data. Note that our analysis may not factor in the latest price-sensitive company announcements or qualitative material. Simply Wall St has no position in any stocks mentioned.
About OM:FRAG
Fragbite Group
Develops and publishes games and esports content for the GAMING, ESPORTS, and WEB3 markets in the Nordic region.
Moderate risk and slightly overvalued.
Market Insights

Advertisement
Weekly Picks
RO


RockeTeller on Santacruz Silver Mining ·
Crazy Undervalued 42 Baggers Silver Play (Active & Running Mine)
Fair Value:CA$8696.7% undervalued
50 followersusers have followed this narrative
6 commentsusers have commented on this narrative
16 likesusers have liked this narrative
RO


Robbo on Fiducian Group ·
Fiducian: Compliance Clouds or Value Opportunity?
Fair Value:AU$122.0% undervalued
7 followersusers have followed this narrative
0 commentsusers have commented on this narrative
0 likesusers have liked this narrative
WO

woodworthfund on Willamette Valley Vineyards ·
Willamette Valley Vineyards (WVVI): Not-So-Great Value
Fair Value:US$247.5% overvalued
9 followersusers have followed this narrative
0 commentsusers have commented on this narrative
1 likeusers have liked this narrative
Recently Updated Narratives
IN

IncomeAssets on Pulse Seismic ·
Watch Pulse Seismic Outperform with 13.6% Revenue Growth in the Coming Years
Fair Value:CA$4.4729.5% undervalued
3 followersusers have followed this narrative
0 commentsusers have commented on this narrative
0 likesusers have liked this narrative
VL

Vladislav on Galleon Gold ·
Significantly undervalued gold explorer in Timmins, finally getting traction
Fair Value:CA$482.8% undervalued
5 followersusers have followed this narrative
0 commentsusers have commented on this narrative
0 likesusers have liked this narrative
FU

FundamentallySarcastic on Credit Corp Group ·
Moderation and Stabilisation: HOLD: Fair Price based on a 4-year Cycle is $12.08
Fair Value:AU$12.6410.8% overvalued
5 followersusers have followed this narrative
0 commentsusers have commented on this narrative
0 likesusers have liked this narrative
Popular Narratives
TH


TheWallstreetKing on MicroVision ·
MicroVision will explode future revenue by 380.37% with a vision towards success
Fair Value:US$6098.5% undervalued
116 followersusers have followed this narrative
11 commentsusers have commented on this narrative
22 likesusers have liked this narrative
AN


AnalystConsensusTarget on NVIDIA ·
NVDA: Expanding AI Demand Will Drive Major Data Center Investments Through 2026
Fair Value:US$250.3926.8% undervalued
957 followersusers have followed this narrative
6 commentsusers have commented on this narrative
25 likesusers have liked this narrative
AN

AnalystConsensusTarget on Alphabet ·
GOOGL: AI Platform Expansion And Cloud Demand Will Support Durable Performance Amid Competitive Pressures
Fair Value:US$323.71.9% undervalued
1342 followersusers have followed this narrative
0 commentsusers have commented on this narrative
17 likesusers have liked this narrative

