
Advertisement
- Sweden
- /
- Entertainment
- /
- OM:FRAG
Fragbite Group AB (publ) (STO:FRAG) Stock's 62% Dive Might Signal An Opportunity But It Requires Some Scrutiny
Unfortunately for some shareholders, the Fragbite Group AB (publ) (STO:FRAG) share price has dived 62% in the last thirty days, prolonging recent pain. The recent drop completes a disastrous twelve months for shareholders, who are sitting on a 99% loss during that time.
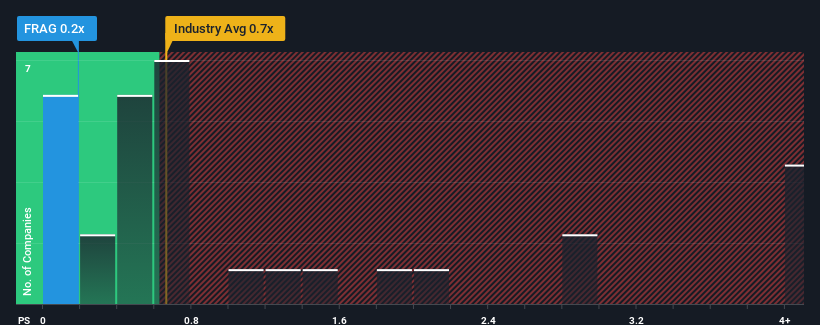
Even after such a large drop in price, it's still not a stretch to say that Fragbite Group's price-to-sales (or "P/S") ratio of 0.2x right now seems quite "middle-of-the-road" compared to the Entertainment industry in Sweden, where the median P/S ratio is around 0.7x. However, investors might be overlooking a clear opportunity or potential setback if there is no rational basis for the P/S.
View our latest analysis for Fragbite Group
How Fragbite Group Has Been Performing
With revenue growth that's inferior to most other companies of late, Fragbite Group has been relatively sluggish. It might be that many expect the uninspiring revenue performance to strengthen positively, which has kept the P/S ratio from falling. If not, then existing shareholders may be a little nervous about the viability of the share price.
Want the full picture on analyst estimates for the company? Then our free report on Fragbite Group will help you uncover what's on the horizon.Do Revenue Forecasts Match The P/S Ratio?
The only time you'd be comfortable seeing a P/S like Fragbite Group's is when the company's growth is tracking the industry closely.
Taking a look back first, we see that the company managed to grow revenues by a handy 6.1% last year. Spectacularly, three year revenue growth has ballooned by several orders of magnitude, even though the last 12 months were fairly tame in comparison. Accordingly, shareholders would have been over the moon with those medium-term rates of revenue growth.
Shifting to the future, estimates from the one analyst covering the company suggest revenue growth will be highly resilient over the next year growing by 81%. That would be an excellent outcome when the industry is expected to decline by 2.3%.
In light of this, it's peculiar that Fragbite Group's P/S sits in-line with the majority of other companies. Apparently some shareholders are skeptical of the contrarian forecasts and have been accepting lower selling prices.
What Does Fragbite Group's P/S Mean For Investors?
Following Fragbite Group's share price tumble, its P/S is just clinging on to the industry median P/S. It's argued the price-to-sales ratio is an inferior measure of value within certain industries, but it can be a powerful business sentiment indicator.
We note that even though Fragbite Group trades at a similar P/S as the rest of the industry, it far eclipses them in terms of forecasted revenue growth. There could be some unobserved threats to revenue preventing the P/S ratio from matching the positive outlook. One such risk is that the company may not live up to analysts' revenue trajectories in tough industry conditions. It appears some are indeed anticipating revenue instability, because the company's current prospects should normally provide a boost to the share price.
Plus, you should also learn about these 4 warning signs we've spotted with Fragbite Group.
It's important to make sure you look for a great company, not just the first idea you come across. So if growing profitability aligns with your idea of a great company, take a peek at this free list of interesting companies with strong recent earnings growth (and a low P/E).
New: AI Stock Screener & Alerts
Our new AI Stock Screener scans the market every day to uncover opportunities.
• Dividend Powerhouses (3%+ Yield)
• Undervalued Small Caps with Insider Buying
• High growth Tech and AI Companies
Or build your own from over 50 metrics.
Have feedback on this article? Concerned about the content? Get in touch with us directly. Alternatively, email editorial-team (at) simplywallst.com.
This article by Simply Wall St is general in nature. We provide commentary based on historical data and analyst forecasts only using an unbiased methodology and our articles are not intended to be financial advice. It does not constitute a recommendation to buy or sell any stock, and does not take account of your objectives, or your financial situation. We aim to bring you long-term focused analysis driven by fundamental data. Note that our analysis may not factor in the latest price-sensitive company announcements or qualitative material. Simply Wall St has no position in any stocks mentioned.
About OM:FRAG
Fragbite Group
Develops and publishes games and esports content for the GAMING, ESPORTS, and WEB3 markets in the Nordic region.
Moderate risk and slightly overvalued.
Market Insights

Advertisement
Weekly Picks
RO


RockeTeller on Santacruz Silver Mining ·
Crazy Undervalued 42 Baggers Silver Play (Active & Running Mine)
Fair Value:CA$8696.7% undervalued
9 followersusers have followed this narrative
5 commentsusers have commented on this narrative
0 likesusers have liked this narrative
RO


Robbo on Fiducian Group ·
Fiducian: Compliance Clouds or Value Opportunity?
Fair Value:AU$126.3% undervalued
1 followerusers have followed this narrative
0 commentsusers have commented on this narrative
0 likesusers have liked this narrative
WO

woodworthfund on Willamette Valley Vineyards ·
Willamette Valley Vineyards (WVVI): Not-So-Great Value
Fair Value:US$242.5% overvalued
2 followersusers have followed this narrative
0 commentsusers have commented on this narrative
1 likeusers have liked this narrative
Recently Updated Narratives
CO

composite32 on Power Solutions International ·
PSIX The timing of insider sales is a serious question mark
Fair Value:US$37.3845.7% overvalued
1 followerusers have followed this narrative
0 commentsusers have commented on this narrative
0 likesusers have liked this narrative
TA


Talos on Marvell Technology ·
The Great Strategy Swap – Selling "Old Auto" to Buy "Future Light"
Fair Value:US$155.3740.2% undervalued
1 followerusers have followed this narrative
0 commentsusers have commented on this narrative
0 likesusers have liked this narrative
TA

Talos on NVIDIA ·
Not a Bubble, But the "Industrial Revolution 4.0" Engine
Fair Value:US$294.9238.5% undervalued
3 followersusers have followed this narrative
0 commentsusers have commented on this narrative
0 likesusers have liked this narrative
Popular Narratives
TH


TheWallstreetKing on MicroVision ·
MicroVision will explode future revenue by 380.37% with a vision towards success
Fair Value:US$6098.6% undervalued
112 followersusers have followed this narrative
11 commentsusers have commented on this narrative
22 likesusers have liked this narrative
AN

AnalystConsensusTarget on NVIDIA ·
NVDA: Expanding AI Demand Will Drive Major Data Center Investments Through 2026
Fair Value:US$250.3927.6% undervalued
946 followersusers have followed this narrative
6 commentsusers have commented on this narrative
24 likesusers have liked this narrative
OS


oscargarcia on Alphabet ·
The company that turned a verb into a global necessity and basically runs the modern internet, digital ads, smartphones, maps, and AI.
Fair Value:US$3407.2% undervalued
147 followersusers have followed this narrative
6 commentsusers have commented on this narrative
18 likesusers have liked this narrative
