
Advertisement
- Sweden
- /
- Healthtech
- /
- OM:SECT B
What Sectra AB (publ)'s (STO:SECT B) 25% Share Price Gain Is Not Telling You
Sectra AB (publ) (STO:SECT B) shareholders have had their patience rewarded with a 25% share price jump in the last month. The last 30 days bring the annual gain to a very sharp 37%.
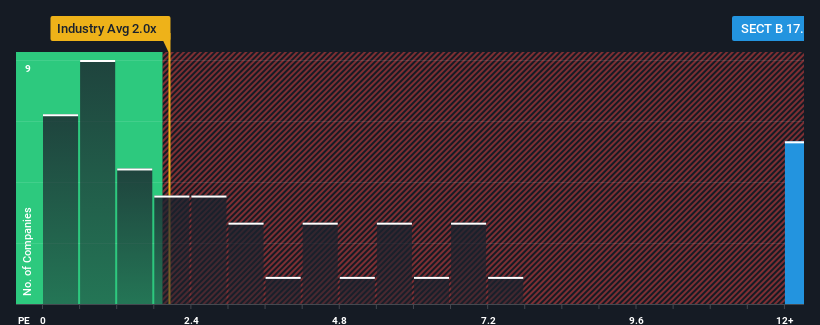
After such a large jump in price, given around half the companies in Sweden's Healthcare Services industry have price-to-sales ratios (or "P/S") below 1.9x, you may consider Sectra as a stock to avoid entirely with its 17.8x P/S ratio. Although, it's not wise to just take the P/S at face value as there may be an explanation why it's so lofty.
We check all companies for important risks. See what we found for Sectra in our free report.See our latest analysis for Sectra
How Has Sectra Performed Recently?
Sectra's revenue growth of late has been pretty similar to most other companies. It might be that many expect the mediocre revenue performance to strengthen positively, which has kept the P/S ratio from falling. You'd really hope so, otherwise you're paying a pretty hefty price for no particular reason.
Want the full picture on analyst estimates for the company? Then our free report on Sectra will help you uncover what's on the horizon.How Is Sectra's Revenue Growth Trending?
There's an inherent assumption that a company should far outperform the industry for P/S ratios like Sectra's to be considered reasonable.
Taking a look back first, we see that the company managed to grow revenues by a handy 15% last year. Pleasingly, revenue has also lifted 76% in aggregate from three years ago, partly thanks to the last 12 months of growth. Accordingly, shareholders would have definitely welcomed those medium-term rates of revenue growth.
Looking ahead now, revenue is anticipated to climb by 12% during the coming year according to the sole analyst following the company. Meanwhile, the rest of the industry is forecast to expand by 12%, which is not materially different.
In light of this, it's curious that Sectra's P/S sits above the majority of other companies. Apparently many investors in the company are more bullish than analysts indicate and aren't willing to let go of their stock right now. These shareholders may be setting themselves up for disappointment if the P/S falls to levels more in line with the growth outlook.
What We Can Learn From Sectra's P/S?
The strong share price surge has lead to Sectra's P/S soaring as well. Using the price-to-sales ratio alone to determine if you should sell your stock isn't sensible, however it can be a practical guide to the company's future prospects.
Seeing as its revenues are forecast to grow in line with the wider industry, it would appear that Sectra currently trades on a higher than expected P/S. Right now we are uncomfortable with the relatively high share price as the predicted future revenues aren't likely to support such positive sentiment for long. Unless the company can jump ahead of the rest of the industry in the short-term, it'll be a challenge to maintain the share price at current levels.
Many other vital risk factors can be found on the company's balance sheet. Take a look at our free balance sheet analysis for Sectra with six simple checks on some of these key factors.
Of course, profitable companies with a history of great earnings growth are generally safer bets. So you may wish to see this free collection of other companies that have reasonable P/E ratios and have grown earnings strongly.
New: Manage All Your Stock Portfolios in One Place
We've created the ultimate portfolio companion for stock investors, and it's free.
• Connect an unlimited number of Portfolios and see your total in one currency
• Be alerted to new Warning Signs or Risks via email or mobile
• Track the Fair Value of your stocks
Have feedback on this article? Concerned about the content? Get in touch with us directly. Alternatively, email editorial-team (at) simplywallst.com.
This article by Simply Wall St is general in nature. We provide commentary based on historical data and analyst forecasts only using an unbiased methodology and our articles are not intended to be financial advice. It does not constitute a recommendation to buy or sell any stock, and does not take account of your objectives, or your financial situation. We aim to bring you long-term focused analysis driven by fundamental data. Note that our analysis may not factor in the latest price-sensitive company announcements or qualitative material. Simply Wall St has no position in any stocks mentioned.
About OM:SECT B
Sectra
Provides solutions for medical IT and cybersecurity sectors in Sweden, the United Kingdom, the Netherlands, and rest of Europe.
Outstanding track record with flawless balance sheet.
Similar Companies
Market Insights

Advertisement
Community Narratives
MicroVision will explode future revenue by 380.37% with a vision towards success
Fair Value US$60|98.4% undervalued
TH
Community Contributor
The Indispensable Artery for a New North American Economy
Fair Value CA$132.87|0.6% undervalued
TI
Community Contributor
Recently Updated Narratives
JO


JohnJ on Worldline ·
No miracle in sight
Fair Value:€7.0178.0% undervalued
7 followersusers have followed this narrative
0 commentsusers have commented on this narrative
0 likesusers have liked this narrative
MA


MarkoVT on COVER ·
Q3 Outlook modestly optimistic
Fair Value:JP¥1.65k2.0% overvalued
1 followerusers have followed this narrative
0 commentsusers have commented on this narrative
0 likesusers have liked this narrative
BL


BlackGoat on Alphabet ·
Alphabet: The Under-appreciated Compounder Hiding in Plain Sight
Fair Value:US$324.481.3% undervalued
79 followersusers have followed this narrative
3 commentsusers have commented on this narrative
1 likeusers have liked this narrative
Popular Narratives
OS

oscargarcia on Alphabet ·
The company that turned a verb into a global necessity and basically runs the modern internet, digital ads, smartphones, maps, and AI.
Fair Value:US$3405.9% undervalued
136 followersusers have followed this narrative
6 commentsusers have commented on this narrative
18 likesusers have liked this narrative
TH

TheWallstreetKing on MicroVision ·
MicroVision will explode future revenue by 380.37% with a vision towards success
Fair Value:US$6098.4% undervalued
90 followersusers have followed this narrative
10 commentsusers have commented on this narrative
18 likesusers have liked this narrative
AN


AnalystConsensusTarget on NVIDIA ·
NVDA: Expanding AI Demand Will Drive Major Data Center Investments Through 2026
Fair Value:US$232.7922.6% undervalued
927 followersusers have followed this narrative
6 commentsusers have commented on this narrative
22 likesusers have liked this narrative