Advertisement
- Denmark
- /
- Real Estate
- /
- CPSE:SIG
European Gems: Compa And 2 Other Prominent Penny Stocks

Simply Wall St
Reviewed by Simply Wall St
As European markets react to higher-than-expected U.S. trade tariffs, with major indices like the STOXX Europe 600 experiencing their largest drop in five years, investors are reassessing their strategies amidst growing economic uncertainty. In this climate, penny stocks—often smaller or newer companies—remain a relevant investment area despite the term's somewhat outdated nature. These stocks can offer unique growth opportunities at lower price points, particularly when they are supported by strong financial health and solid fundamentals.
Top 10 Penny Stocks In Europe
| Name | Share Price | Market Cap | Rewards & Risks |
| Bredband2 i Skandinavien (OM:BRE2) | SEK1.99 | SEK1.9B | ✅ 4 ⚠️ 0 View Analysis > |
| Transferator (NGM:TRAN A) | SEK2.50 | SEK231.11M | ✅ 2 ⚠️ 3 View Analysis > |
| Angler Gaming (NGM:ANGL) | SEK3.55 | SEK266.2M | ✅ 4 ⚠️ 3 View Analysis > |
| Hifab Group (OM:HIFA B) | SEK3.94 | SEK239.71M | ✅ 2 ⚠️ 2 View Analysis > |
| IMS (WSE:IMS) | PLN3.45 | PLN116.93M | ✅ 3 ⚠️ 2 View Analysis > |
| Cellularline (BIT:CELL) | €2.50 | €52.73M | ✅ 4 ⚠️ 2 View Analysis > |
| Netgem (ENXTPA:ALNTG) | €0.982 | €32.88M | ✅ 3 ⚠️ 3 View Analysis > |
| Arcure (ENXTPA:ALCUR) | €4.16 | €24.09M | ✅ 3 ⚠️ 3 View Analysis > |
| Nurminen Logistics Oyj (HLSE:NLG1V) | €1.04 | €83.78M | ✅ 2 ⚠️ 4 View Analysis > |
| Deceuninck (ENXTBR:DECB) | €2.05 | €283.03M | ✅ 3 ⚠️ 1 View Analysis > |
Click here to see the full list of 427 stocks from our European Penny Stocks screener.
Let's uncover some gems from our specialized screener.
Compa (BVB:CMP)
Simply Wall St Financial Health Rating: ★★★★★★
Overview: Compa S.A. manufactures and sells motor vehicle parts and accessories in Romania, with a market cap of RON111.04 million.
Operations: The company generates revenue of RON650.78 million from its Auto Parts & Accessories segment.
Market Cap: RON111.04M
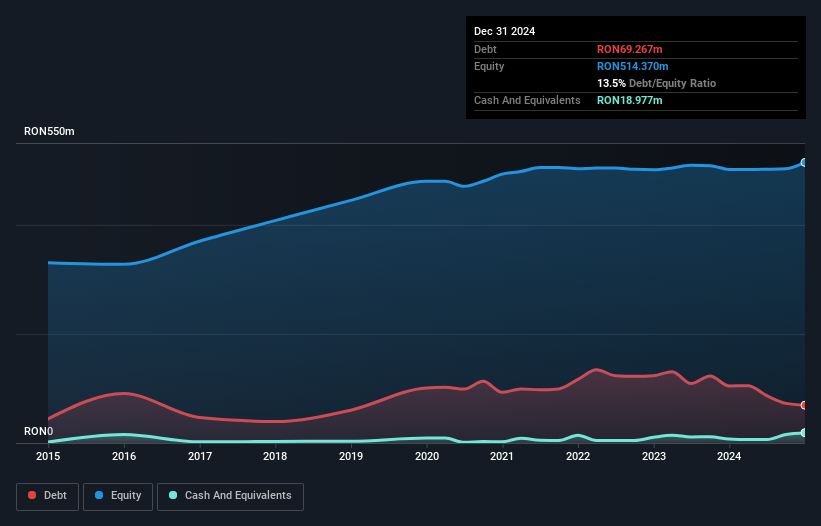
Compa S.A. has shown resilience in the penny stock arena with a market cap of RON111.04 million and revenue of RON650.78 million from its Auto Parts & Accessories segment. Despite a 53.9% annual earnings decline over five years, recent growth is notable at 95.5%. The company maintains solid financial health, with short-term assets covering liabilities and debt well-managed by cash flow. Recent earnings improvements have resulted in higher profit margins, though they remain slim at 0.2%. Trading significantly below estimated fair value, Compa offers potential for investors seeking undervalued opportunities in the European market.
- Navigate through the intricacies of Compa with our comprehensive balance sheet health report here.
- Explore historical data to track Compa's performance over time in our past results report.
Scandinavian Investment Group (CPSE:SIG)
Simply Wall St Financial Health Rating: ★★★★☆☆
Overview: Scandinavian Investment Group A/S focuses on investing in real estate properties within Denmark and has a market capitalization of DKK150.55 million.
Operations: Scandinavian Investment Group A/S does not report specific revenue segments.
Market Cap: DKK150.55M
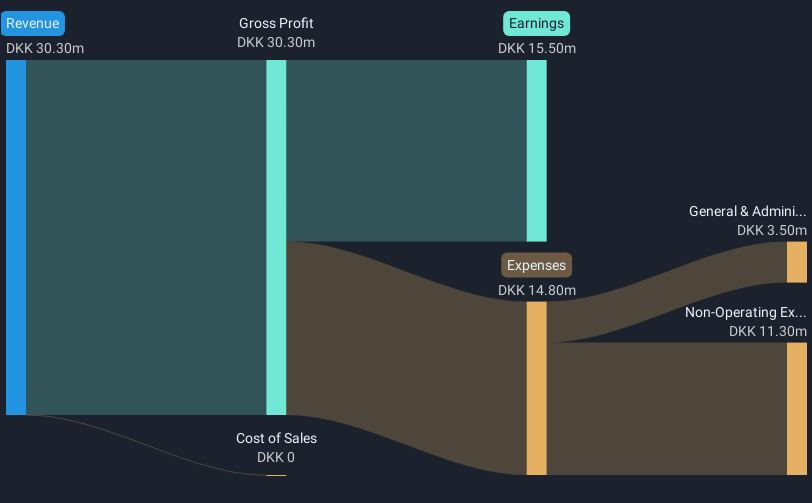
Scandinavian Investment Group A/S, with a market cap of DKK150.55 million, operates primarily in the Danish real estate sector. The company reported sales of DKK12.2 million for 2024, indicating limited revenue generation. Despite this, net income grew to DKK15.5 million due to improved profit margins and one-off items affecting earnings quality. The company's financial position is robust; short-term assets significantly exceed liabilities and it holds more cash than debt, although its debt-to-equity ratio has increased over five years. Trading below estimated fair value with stable volatility, Scandinavian Investment Group presents a cautious opportunity in the European penny stock landscape.
- Get an in-depth perspective on Scandinavian Investment Group's performance by reading our balance sheet health report here.
- Examine Scandinavian Investment Group's past performance report to understand how it has performed in prior years.
Nanexa (OM:NANEXA)
Simply Wall St Financial Health Rating: ★★★★★★
Overview: Nanexa AB (publ) is a nanotechnology drug delivery company with a market cap of SEK156.05 million.
Operations: The company's revenue is derived entirely from its Drug Delivery Systems segment, amounting to SEK46.69 million.
Market Cap: SEK156.05M
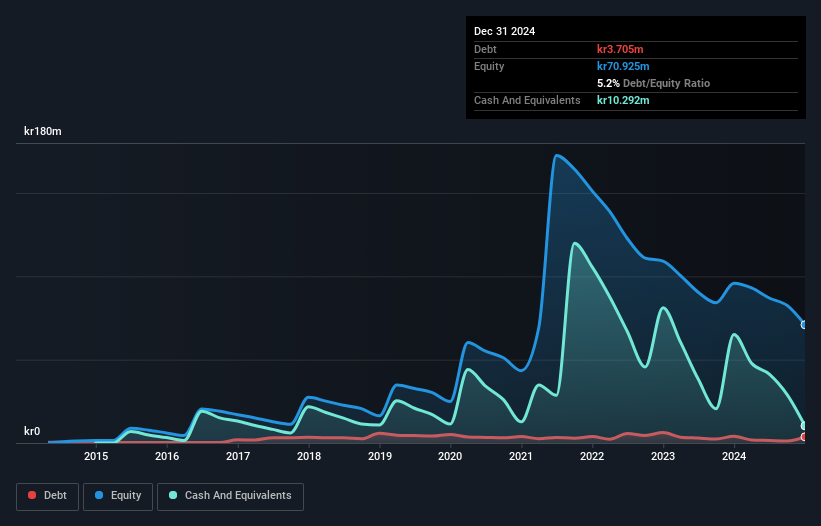
Nanexa AB, with a market cap of SEK156.05 million, is a pre-revenue nanotechnology drug delivery company focused on its NEX-22 formulation for Type 2 diabetes. Recent advancements in their Phase I study mark significant progress, enhancing the potential for future clinical studies. Despite being unprofitable and experiencing high share price volatility, Nanexa's financial health shows short-term assets exceeding liabilities and more cash than debt. The company's recent SEK35 million equity offering strengthens its capital position amidst a limited cash runway. While losses have increased over five years, management's seasoned experience may guide strategic developments forward.
- Dive into the specifics of Nanexa here with our thorough balance sheet health report.
- Learn about Nanexa's historical performance here.
Seize The Opportunity
- Click this link to deep-dive into the 427 companies within our European Penny Stocks screener.
- Want To Explore Some Alternatives? We've found 30 US stocks that are forecast to pay a dividend yeild of over 6% next year. See the full list for free.
This article by Simply Wall St is general in nature. We provide commentary based on historical data and analyst forecasts only using an unbiased methodology and our articles are not intended to be financial advice. It does not constitute a recommendation to buy or sell any stock, and does not take account of your objectives, or your financial situation. We aim to bring you long-term focused analysis driven by fundamental data. Note that our analysis may not factor in the latest price-sensitive company announcements or qualitative material. Simply Wall St has no position in any stocks mentioned.
New: Manage All Your Stock Portfolios in One Place
We've created the ultimate portfolio companion for stock investors, and it's free.
• Connect an unlimited number of Portfolios and see your total in one currency
• Be alerted to new Warning Signs or Risks via email or mobile
• Track the Fair Value of your stocks
Have feedback on this article? Concerned about the content? Get in touch with us directly. Alternatively, email editorial-team@simplywallst.com
About CPSE:SIG
Scandinavian Investment Group
Invests in real estate properties in Denmark.
Adequate balance sheet with slight risk.
Similar Companies
Market Insights

Advertisement
Community Narratives
MINISO's fair value is projected at 26.69 with an anticipated PE ratio shift of 20x
Fair Value US$24.03|11.0% undervalued
BE
Community Contributor
Procter & Gamble: A Dividend Giant Facing Slowing Growth
Fair Value US$119.81|23.3% overvalued
AN
Community Contributor
Eli Lilly's Future Growth Driven by Tirzepatide and Favorable Market Conditions
Fair Value US$1.19k|13.8% undervalued
EA
Community Contributor