
Advertisement
Would Umida Group (NGM:UMIDA B) Be Better Off With Less Debt?
David Iben put it well when he said, 'Volatility is not a risk we care about. What we care about is avoiding the permanent loss of capital.' So it might be obvious that you need to consider debt, when you think about how risky any given stock is, because too much debt can sink a company. We note that Umida Group AB (publ) (NGM:UMIDA B) does have debt on its balance sheet. But is this debt a concern to shareholders?
What Risk Does Debt Bring?
Debt is a tool to help businesses grow, but if a business is incapable of paying off its lenders, then it exists at their mercy. In the worst case scenario, a company can go bankrupt if it cannot pay its creditors. However, a more common (but still painful) scenario is that it has to raise new equity capital at a low price, thus permanently diluting shareholders. By replacing dilution, though, debt can be an extremely good tool for businesses that need capital to invest in growth at high rates of return. When we examine debt levels, we first consider both cash and debt levels, together.
See our latest analysis for Umida Group
How Much Debt Does Umida Group Carry?
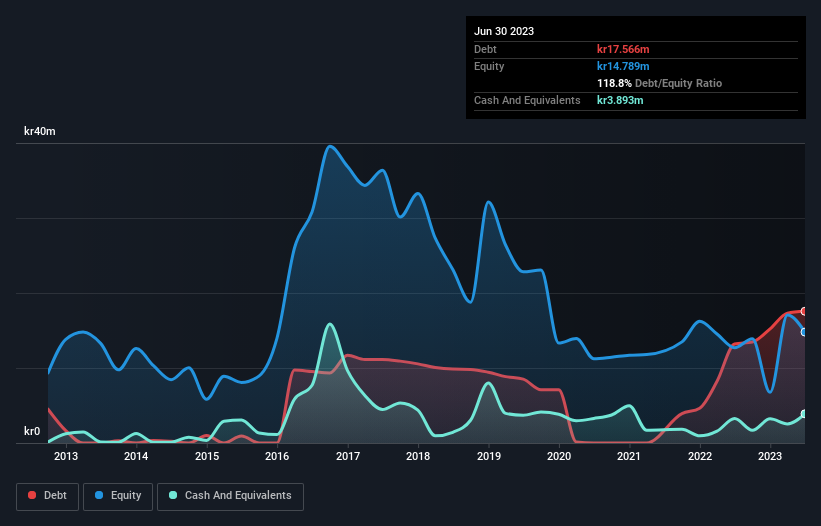
The image below, which you can click on for greater detail, shows that at June 2023 Umida Group had debt of kr17.6m, up from kr13.2m in one year. However, because it has a cash reserve of kr3.89m, its net debt is less, at about kr13.7m.
A Look At Umida Group's Liabilities
We can see from the most recent balance sheet that Umida Group had liabilities of kr42.6m falling due within a year, and liabilities of kr14.2m due beyond that. Offsetting this, it had kr3.89m in cash and kr35.4m in receivables that were due within 12 months. So its liabilities total kr17.5m more than the combination of its cash and short-term receivables.
Umida Group has a market capitalization of kr54.0m, so it could very likely raise cash to ameliorate its balance sheet, if the need arose. However, it is still worthwhile taking a close look at its ability to pay off debt. There's no doubt that we learn most about debt from the balance sheet. But it is Umida Group's earnings that will influence how the balance sheet holds up in the future. So if you're keen to discover more about its earnings, it might be worth checking out this graph of its long term earnings trend.
In the last year Umida Group had a loss before interest and tax, and actually shrunk its revenue by 26%, to kr62m. To be frank that doesn't bode well.
Caveat Emptor
Not only did Umida Group's revenue slip over the last twelve months, but it also produced negative earnings before interest and tax (EBIT). Indeed, it lost a very considerable kr10m at the EBIT level. When we look at that and recall the liabilities on its balance sheet, relative to cash, it seems unwise to us for the company to have any debt. So we think its balance sheet is a little strained, though not beyond repair. Another cause for caution is that is bled kr14m in negative free cash flow over the last twelve months. So suffice it to say we consider the stock very risky. The balance sheet is clearly the area to focus on when you are analysing debt. However, not all investment risk resides within the balance sheet - far from it. Be aware that Umida Group is showing 4 warning signs in our investment analysis , and 3 of those are a bit concerning...
If, after all that, you're more interested in a fast growing company with a rock-solid balance sheet, then check out our list of net cash growth stocks without delay.
New: AI Stock Screener & Alerts
Our new AI Stock Screener scans the market every day to uncover opportunities.
• Dividend Powerhouses (3%+ Yield)
• Undervalued Small Caps with Insider Buying
• High growth Tech and AI Companies
Or build your own from over 50 metrics.
Have feedback on this article? Concerned about the content? Get in touch with us directly. Alternatively, email editorial-team (at) simplywallst.com.
This article by Simply Wall St is general in nature. We provide commentary based on historical data and analyst forecasts only using an unbiased methodology and our articles are not intended to be financial advice. It does not constitute a recommendation to buy or sell any stock, and does not take account of your objectives, or your financial situation. We aim to bring you long-term focused analysis driven by fundamental data. Note that our analysis may not factor in the latest price-sensitive company announcements or qualitative material. Simply Wall St has no position in any stocks mentioned.
About NGM:UMIDA B
Umida Group
Produces, markets, and sells wine, spirits, ciders, mixed drinks, mulled wines, and other alcoholic beverages in Sweden.
Excellent balance sheet slight.
Market Insights

Advertisement
Community Narratives
MicroVision will explode future revenue by 380.37% with a vision towards success
Fair Value US$60.00|98.4% undervalued
TH
Community Contributor
The Indispensable Artery for a New North American Economy
Fair Value CA$132.87|1.3% undervalued
TI
Community Contributor