
Advertisement
- Sweden
- /
- Oil and Gas
- /
- OM:CCOR B
There's No Escaping Concordia Maritime AB (publ)'s (STO:CCOR B) Muted Revenues Despite A 55% Share Price Rise
Concordia Maritime AB (publ) (STO:CCOR B) shareholders have had their patience rewarded with a 55% share price jump in the last month. The last 30 days bring the annual gain to a very sharp 54%.
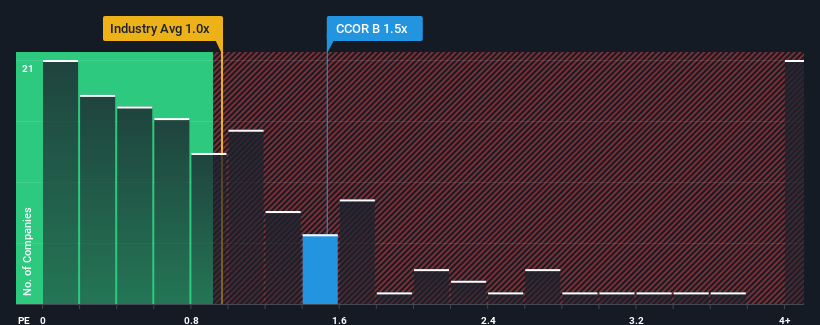
Even after such a large jump in price, Concordia Maritime may still look like a strong buying opportunity at present with its price-to-sales (or "P/S") ratio of 1.5x, considering almost half of all companies in the Oil and Gas industry in Sweden have P/S ratios greater than 4.1x and even P/S higher than 23x aren't out of the ordinary. Nonetheless, we'd need to dig a little deeper to determine if there is a rational basis for the highly reduced P/S.
See our latest analysis for Concordia Maritime
How Concordia Maritime Has Been Performing
For instance, Concordia Maritime's receding revenue in recent times would have to be some food for thought. It might be that many expect the disappointing revenue performance to continue or accelerate, which has repressed the P/S. However, if this doesn't eventuate then existing shareholders may be feeling optimistic about the future direction of the share price.
Want the full picture on earnings, revenue and cash flow for the company? Then our free report on Concordia Maritime will help you shine a light on its historical performance.What Are Revenue Growth Metrics Telling Us About The Low P/S?
Concordia Maritime's P/S ratio would be typical for a company that's expected to deliver very poor growth or even falling revenue, and importantly, perform much worse than the industry.
Retrospectively, the last year delivered a frustrating 48% decrease to the company's top line. This means it has also seen a slide in revenue over the longer-term as revenue is down 75% in total over the last three years. Accordingly, shareholders would have felt downbeat about the medium-term rates of revenue growth.
Weighing that medium-term revenue trajectory against the broader industry's one-year forecast for expansion of 0.4% shows it's an unpleasant look.
In light of this, it's understandable that Concordia Maritime's P/S would sit below the majority of other companies. Nonetheless, there's no guarantee the P/S has reached a floor yet with revenue going in reverse. Even just maintaining these prices could be difficult to achieve as recent revenue trends are already weighing down the shares.
What Does Concordia Maritime's P/S Mean For Investors?
Concordia Maritime's recent share price jump still sees fails to bring its P/S alongside the industry median. While the price-to-sales ratio shouldn't be the defining factor in whether you buy a stock or not, it's quite a capable barometer of revenue expectations.
Our examination of Concordia Maritime confirms that the company's shrinking revenue over the past medium-term is a key factor in its low price-to-sales ratio, given the industry is projected to grow. Right now shareholders are accepting the low P/S as they concede future revenue probably won't provide any pleasant surprises either. If recent medium-term revenue trends continue, it's hard to see the share price moving strongly in either direction in the near future under these circumstances.
It is also worth noting that we have found 3 warning signs for Concordia Maritime (2 are a bit concerning!) that you need to take into consideration.
If you're unsure about the strength of Concordia Maritime's business, why not explore our interactive list of stocks with solid business fundamentals for some other companies you may have missed.
New: AI Stock Screener & Alerts
Our new AI Stock Screener scans the market every day to uncover opportunities.
• Dividend Powerhouses (3%+ Yield)
• Undervalued Small Caps with Insider Buying
• High growth Tech and AI Companies
Or build your own from over 50 metrics.
Have feedback on this article? Concerned about the content? Get in touch with us directly. Alternatively, email editorial-team (at) simplywallst.com.
This article by Simply Wall St is general in nature. We provide commentary based on historical data and analyst forecasts only using an unbiased methodology and our articles are not intended to be financial advice. It does not constitute a recommendation to buy or sell any stock, and does not take account of your objectives, or your financial situation. We aim to bring you long-term focused analysis driven by fundamental data. Note that our analysis may not factor in the latest price-sensitive company announcements or qualitative material. Simply Wall St has no position in any stocks mentioned.
About OM:CCOR B
Concordia Maritime
Concordia Maritime AB (publ) operates as a tanker shipping company in Sweden and internationally.
Flawless balance sheet with acceptable track record.
Similar Companies
Market Insights

Advertisement
Community Narratives
The company that turned a verb into a global necessity and basically runs the modern internet, digital ads, smartphones, maps, and AI.
Fair Value US$300.00|5.2% undervalued
OS
Community Contributor
Flowers Foods Pays A Fair Price For Health
Fair Value US$16.12|25.4% undervalued
NV
Community Contributor
TMX Group will thrive with 33.3% profit margin and enduring market moat
Fair Value CA$49.90|3.6% overvalued
LI
Community Contributor
The "Molecular Pencil": Why Beam's Technology is Built to Win
Fair Value US$65.01|64.5% undervalued
DA
Community Contributor