Advertisement
- Sweden
- /
- Capital Markets
- /
- OM:MANG
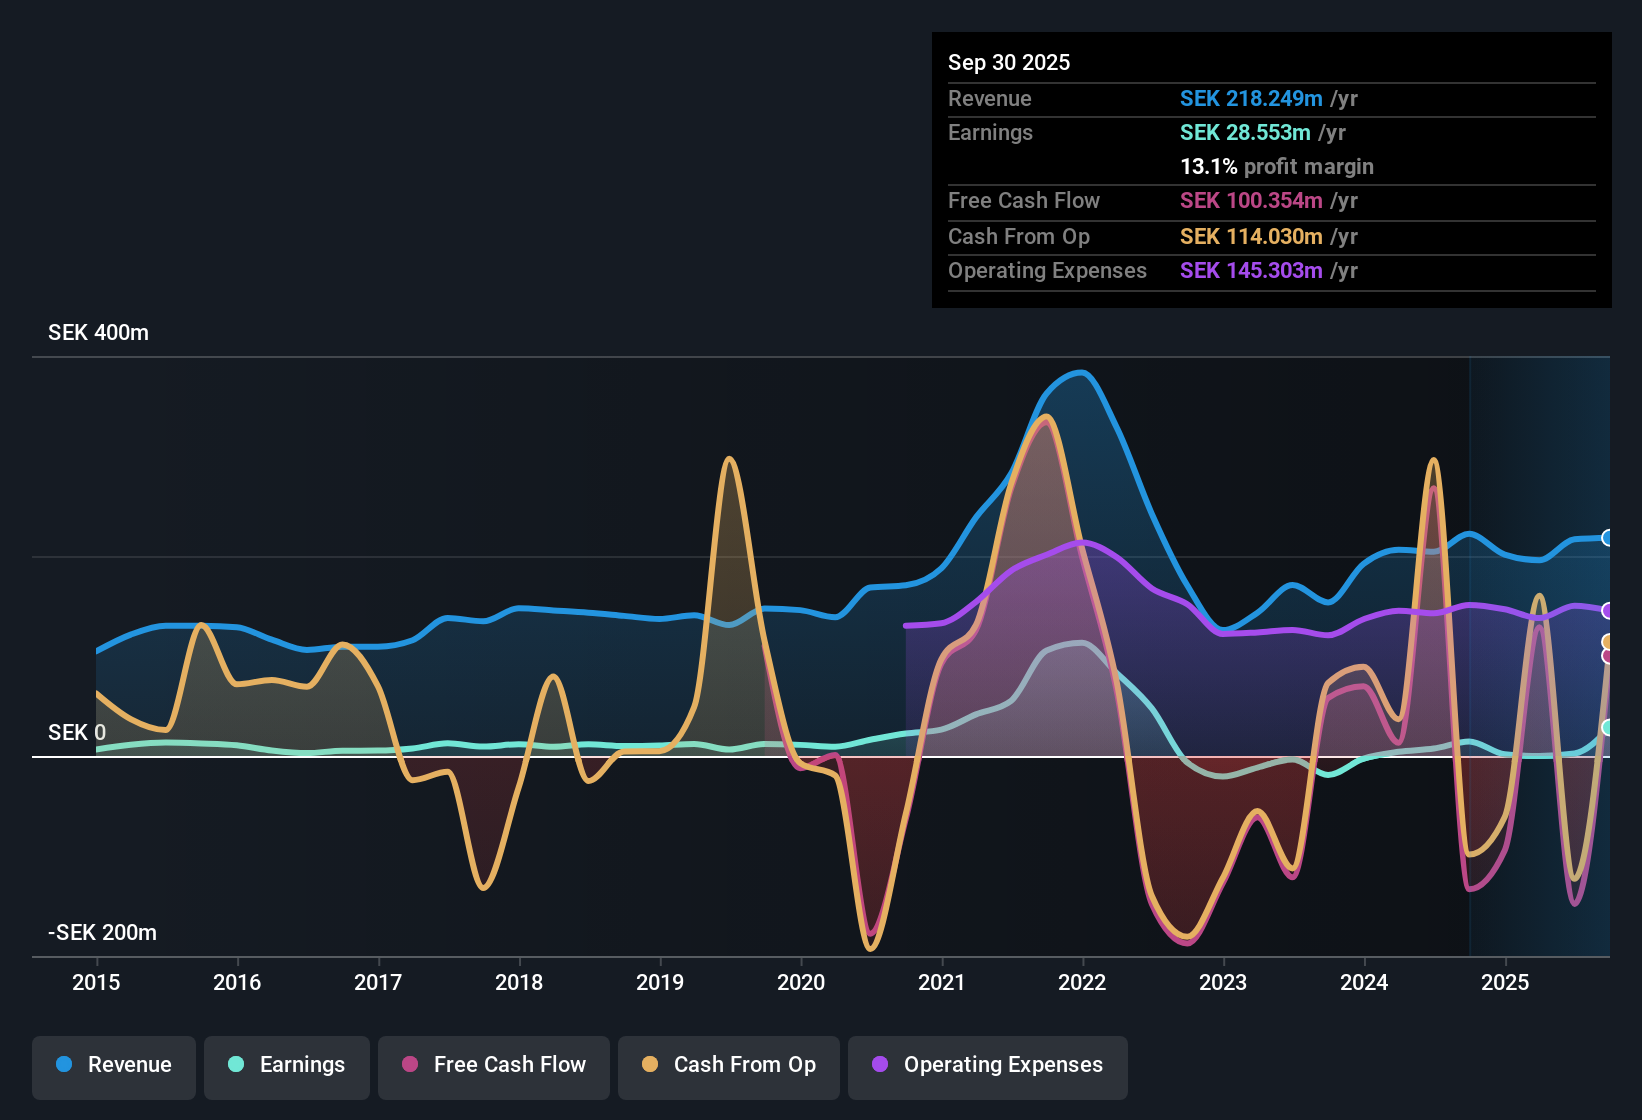
Mangold Fondkommission (OM:MANG) Net Profit Margin Falls to 1.1%, Undermining Quality Earnings Narrative

Simply Wall St
Reviewed by Simply Wall St
Mangold Fondkommission (OM:MANG) posted a net profit margin of 1.1%, slipping from last year’s 3.7% mark, with earnings shrinking at an annualized rate of 50.3% over the past five years. The company’s most recent results highlight a continued negative trend in earnings growth, and with no improvement in net margins or expectations for revenue and earnings to grow, investor sentiment remains cautious. High-quality earnings classification offers some reassurance, but the lack of rewards in the latest figures suggests risks remain front-of-mind for shareholders.
See our full analysis for Mangold Fondkommission.Next, we will look at how these earnings figures hold up when measured against the market narratives that drive expectations. Some beliefs may be confirmed, while others might face new challenges.
Curious how numbers become stories that shape markets? Explore Community Narratives
High-Quality Earnings, but Rapid Decline Continues
- The company’s earnings have shrunk at an annualized rate of 50.3% over the past five years, while they still receive a high-quality classification despite this sharp drop.
- With results showing negative growth and no improvement in net profit margin, compare this to the prevailing market view that Mangold may appeal to more risk-averse investors:
- The lack of any downside-surprise or major negative news limits fresh risks but equally removes drivers for near-term improvement. Investors are left waiting for a potential positive catalyst to change the trajectory.
- This slow decline stands out in a sector where steady, continuously adaptive management is often rewarded. Here, high-quality earnings provide some minimal comfort, yet persistent declines challenge any hint of stability that cautious investors typically look for.
Valuation Sits Above Industry, Lags Direct Peers
- Mangold’s Price-to-Sales Ratio is 4.4x, which is higher than the Swedish Capital Markets industry average of 2.8x but slightly below its peer average of 4.9x.
- Without any positive earnings momentum, the prevailing market view notes the share is priced above general industry but lacks the premium of top peers:
- This suggests investors expect Mangold’s performance and outlook to land somewhere between typical sector players and stronger, direct competitors, putting a ceiling on near-term upside until the financials improve.
- Sector moves, such as an uplift for financial services generally, could help. However, without stronger company-specific signals, Mangold may just track broader market trends rather than outpace them.
No Growth Drivers Highlighted Amid Revenue, Earnings Stagnation
- Recent data does not indicate improvement in net profit margin or any expectation for revenue and earnings to pick up in the near future.
- The prevailing market analysis frames this as a quiet period dominated by “wait-and-see” sentiment:
- Investors have limited reason to anticipate an inflection point, so Mangold’s current situation is characterized more by muted market activity and monitoring than speculation or action.
- Only a material update or fresh catalyst could change the status quo, leaving the share price vulnerable to any surprise sector news or regulatory development.
See what the community is saying about Mangold Fondkommission
Next Steps
Don't just look at this quarter; the real story is in the long-term trend. We've done an in-depth analysis on Mangold Fondkommission's growth and its valuation to see if today's price is a bargain. Add the company to your watchlist or portfolio now so you don't miss the next big move.
Explore Alternatives
Mangold’s declining earnings, stagnant revenues, and lack of growth drivers highlight a business that is struggling to deliver steady results or inspire confidence.
If consistent growth is what you’re after, now is the time to use our stable growth stocks screener (2090 results) to pinpoint companies that deliver reliable earnings and revenue across all market conditions.
This article by Simply Wall St is general in nature. We provide commentary based on historical data and analyst forecasts only using an unbiased methodology and our articles are not intended to be financial advice. It does not constitute a recommendation to buy or sell any stock, and does not take account of your objectives, or your financial situation. We aim to bring you long-term focused analysis driven by fundamental data. Note that our analysis may not factor in the latest price-sensitive company announcements or qualitative material. Simply Wall St has no position in any stocks mentioned.
New: Manage All Your Stock Portfolios in One Place
We've created the ultimate portfolio companion for stock investors, and it's free.
• Connect an unlimited number of Portfolios and see your total in one currency
• Be alerted to new Warning Signs or Risks via email or mobile
• Track the Fair Value of your stocks
Have feedback on this article? Concerned about the content? Get in touch with us directly. Alternatively, email editorial-team@simplywallst.com
About OM:MANG
Mangold Fondkommission
Provides financial services to companies, institutions, and private individuals in Sweden.
Flawless balance sheet with very low risk.
Market Insights

Advertisement
Community Narratives
Finding The True Value Of A Logistics Powerhouse
Fair Value US$95.21|8.6% undervalued
NV
Community Contributor
Paradigm Biopharmaceuticals Will Lead Osteoarthritis Treatment with Zilosul's FDA Success
Fair Value AU$5.50|92.1% undervalued
AM
Community Contributor
Barrick Mining (ABX:CA): A Gold Hedge against a U.S. Shutdown
Fair Value CA$60.00|25.6% undervalued
GM
Community Contributor