
Advertisement
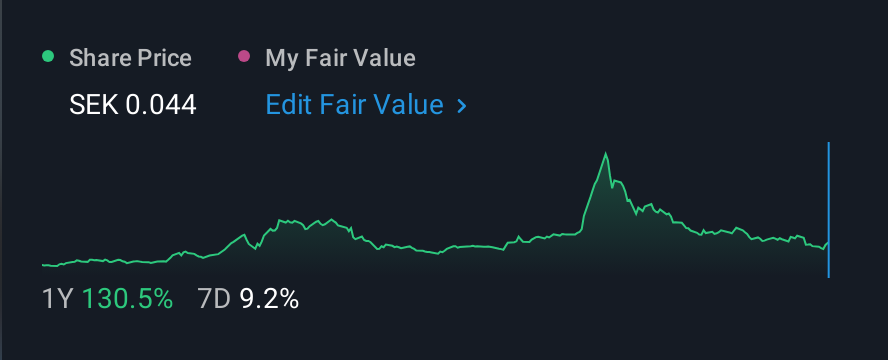
K33 AB (publ) (STO:K33) shares have retraced a considerable 31% in the last month, reversing a fair amount of their solid recent performance. Of course, over the longer-term many would still wish they owned shares as the stock's price has soared 144% in the last twelve months.
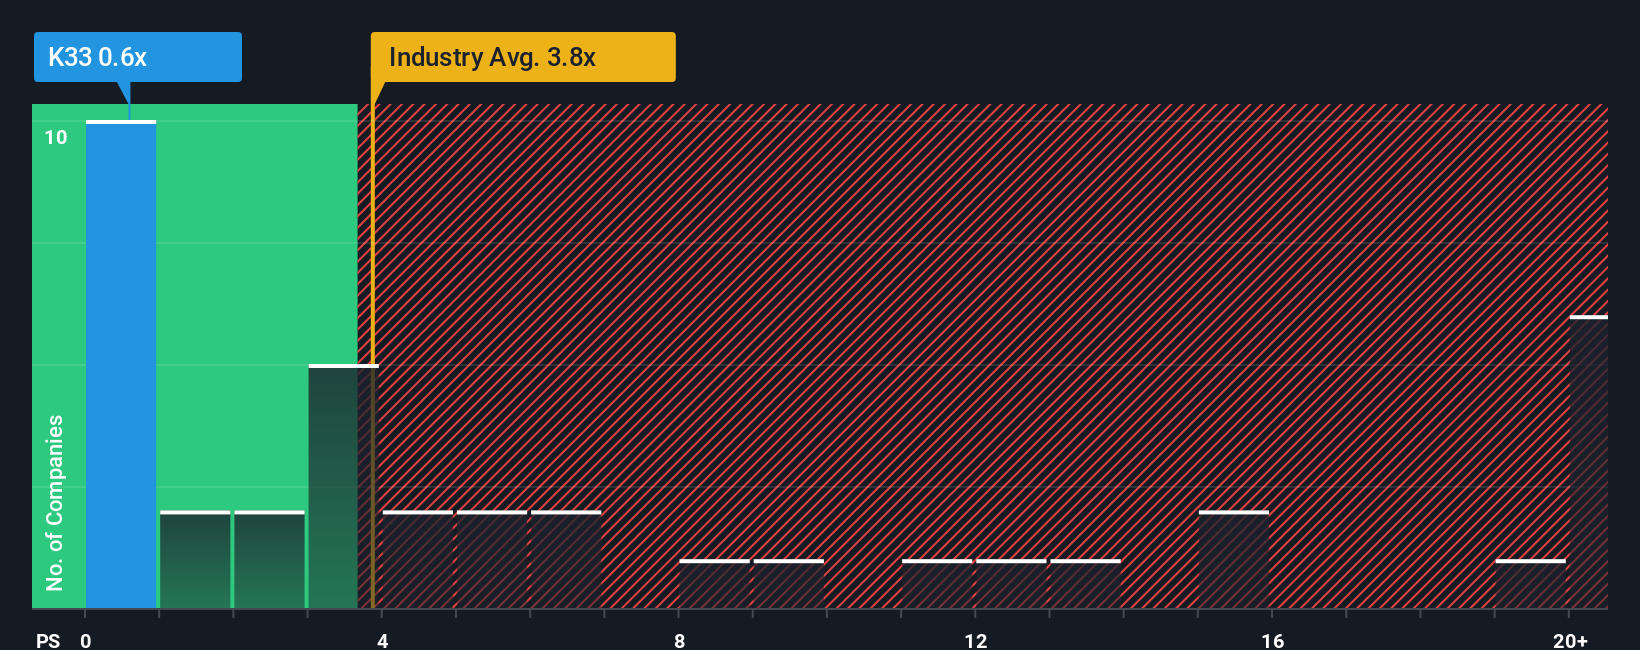
After such a large drop in price, K33 may be sending very bullish signals at the moment with its price-to-sales (or "P/S") ratio of 0.6x, since almost half of all companies in the Capital Markets industry in Sweden have P/S ratios greater than 3.8x and even P/S higher than 13x are not unusual. Although, it's not wise to just take the P/S at face value as there may be an explanation why it's so limited.
See our latest analysis for K33
What Does K33's Recent Performance Look Like?
With revenue growth that's exceedingly strong of late, K33 has been doing very well. It might be that many expect the strong revenue performance to degrade substantially, which has repressed the P/S ratio. If that doesn't eventuate, then existing shareholders have reason to be quite optimistic about the future direction of the share price.
We don't have analyst forecasts, but you can see how recent trends are setting up the company for the future by checking out our free report on K33's earnings, revenue and cash flow.How Is K33's Revenue Growth Trending?
In order to justify its P/S ratio, K33 would need to produce anemic growth that's substantially trailing the industry.
Retrospectively, the last year delivered an explosive gain to the company's top line. The latest three year period has also seen an excellent 189% overall rise in revenue, aided by its incredible short-term performance. So we can start by confirming that the company has done a great job of growing revenue over that time.
When compared to the industry's one-year growth forecast of 3.4%, the most recent medium-term revenue trajectory is noticeably more alluring
With this in mind, we find it intriguing that K33's P/S isn't as high compared to that of its industry peers. Apparently some shareholders believe the recent performance has exceeded its limits and have been accepting significantly lower selling prices.
The Final Word
Shares in K33 have plummeted and its P/S has followed suit. Using the price-to-sales ratio alone to determine if you should sell your stock isn't sensible, however it can be a practical guide to the company's future prospects.
Our examination of K33 revealed its three-year revenue trends aren't boosting its P/S anywhere near as much as we would have predicted, given they look better than current industry expectations. When we see strong revenue with faster-than-industry growth, we assume there are some significant underlying risks to the company's ability to make money which is applying downwards pressure on the P/S ratio. While recent revenue trends over the past medium-term suggest that the risk of a price decline is low, investors appear to perceive a likelihood of revenue fluctuations in the future.
There are also other vital risk factors to consider and we've discovered 2 warning signs for K33 (1 doesn't sit too well with us!) that you should be aware of before investing here.
If companies with solid past earnings growth is up your alley, you may wish to see this free collection of other companies with strong earnings growth and low P/E ratios.
Valuation is complex, but we're here to simplify it.
Discover if K33 might be undervalued or overvalued with our detailed analysis, featuring fair value estimates, potential risks, dividends, insider trades, and its financial condition.
Access Free AnalysisHave feedback on this article? Concerned about the content? Get in touch with us directly. Alternatively, email editorial-team (at) simplywallst.com.
This article by Simply Wall St is general in nature. We provide commentary based on historical data and analyst forecasts only using an unbiased methodology and our articles are not intended to be financial advice. It does not constitute a recommendation to buy or sell any stock, and does not take account of your objectives, or your financial situation. We aim to bring you long-term focused analysis driven by fundamental data. Note that our analysis may not factor in the latest price-sensitive company announcements or qualitative material. Simply Wall St has no position in any stocks mentioned.
About OM:K33
K33
Through its subsidiaries, invests in digital assets in Sweden and internationally.
Mediocre balance sheet with low risk.
Similar Companies
Market Insights


Advertisement
Community Narratives
The Next Phase of Energy Storage: How NeoVolta Is Tackling America’s Power Crunch
Fair Value US$7.50|39.3% undervalued
MA
Community Contributor
Why EnSilica is Worth Possibly 13x its Current Price
Fair Value UK£5.00|91.8% undervalued
DO
Community Contributor
A case for Cassiar Gold Corp (TSXV: GLDC) to reach CAD$8-10 before 2030 (X30-37)
Fair Value CA$10.00|97.4% undervalued
AG
Community Contributor
M&A Activity, Industry Diversification & A Defense Contract Monopoly Will Push BWXT For Healthy Long-Term Growth
Fair Value US$220.00|17.3% undervalued
CL
Community Contributor